BLOG
VIX Trade Idea
Mark Fenton (at Sheridan Mentoring) wrote an article about an “interesting VIX trade.” Mark’s trade was based on the assumption that the VIX could go a lot higher and that you wanted to buy calls. Let’s look at his idea.
Mark started with a put credit spread and used the credit to lower the cost of the long call. The first question I have is why did he use a two lot of both put verticals and long calls? That’s complicating the idea. Just use a one lot.
The second question I had is what is the expected return? Am I more likely to make money with a long call or with Mark’s trade? Let’s look at them
Long Call

The call Mark bought was a SEP 17 call for $1.75. Using the SEP 17 call volatility of 92.3%, the probability of profit is 33% and the Expected Return is $29 +/- $344. The expiration breakeven price is $18.78 (+15%). Note that the expected return is close to zero, which means the option market is pretty efficient. Margin required is $175.
Tom’s Trading Update for August 6, 2014
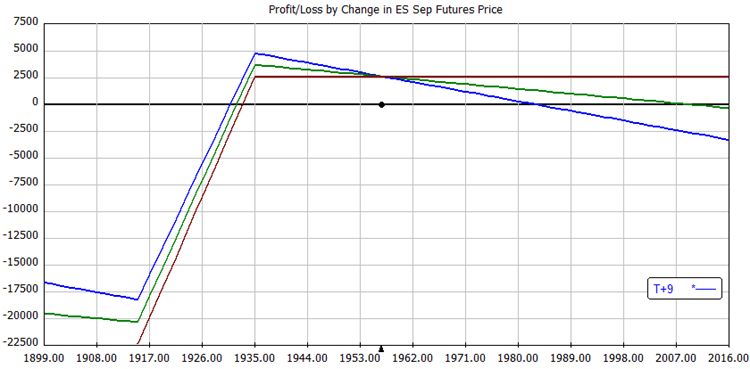
The video below reviews my SPX and ES futures options broken wing butterfly trades. The SPX closed flat today. Volatility came out a little so our position P/L improved. The ES position is nearly at a profit! No economic factors today.
Tom compared the OptionVue probability calculator to using the delta to estimate the probability of an option expiring in-the-money.
Enjoy the video!
Tom’s Trading Update for August 5, 2014
The video below reviews my SPX and ES futures options broken wing butterfly trades. The SPX closed down again today over 18 points. Average True Range continues to rise. No economic factors today. Briefing.com speculated it was profit taking driving the markets lower.
Enjoy the video!
Tom’s Trading Update for August 4, 2014
The video below reviews my SPX and ES futures options broken wing butterfly trades. The SPX closed up over 13 points and had another day with a large intra-day swing of nearly 22 points. Average True Range bumped up to 16.
Enjoy the video!
Tom’s Trading Update for August 1, 2014
The video below reviews my SPX and ES futures options broken wing butterfly trades. The SPX closed down a few points but had quite a bit of movement intraday.
Enjoy the video!
Tom’s Trading Update for July 30, 2014
The video below reviews my SPX and ES futures options broken wing butterfly trades. The GDP and FOMC announcement moved the markets twice today. Both times up initially, then a pull back. The SPX closed nearly where it started but had nearly a 17 point range…so lots of excitement for everyone! I’ll update the trade with the new charts in the forums.
Enjoy the video!

Trading with Futures Options
About thirteen years ago, as I was approaching retirement from the U.S. Air Force, I knew I would have more time to devote to trading. I have a friend in Australia with two PhDs who built his own trading software in the 90s. His software exclusively used the ES futures for intraday trading. I spent a lot of time learning how to use his software and studying technical analysis and directional trading techniques. It’s very different than the income style of option trading that I’ve gravitate to now.
Getting Educated
Before I started trading futures, I wanted to understand what they were and how they traded. The best place to start with are where the contract specifications are. In the case of the ES futures, that’s at the CME’s web site:
http://www.cmegroup.com/trading/equity-index/us-index/e-mini-sandp500_contract_specifications.html
Tom’s Trading Update for July 29, 2014
The video below reviews my SPX and ES futures options broken wing butterfly trades. I was filled on a put debit spread on the ES futures options after the regular market was closed. I’ll update the trade with the new charts in the forums.
Enjoy the video!
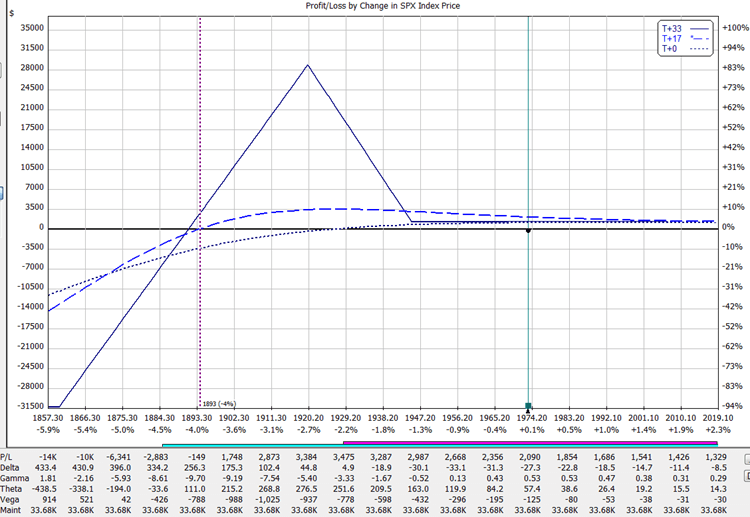
SPX Aug 23 (W4) Broken Wing Butterfly
Time for a new trade in SPX. Another broken wing butterfly trade expiring on Aug 23rd with 33 days to expiration. The ten lot of puts are at 1945/1920/1860. The 1920’s were about a -19 true delta (in OptionVue). I sold two lots at a $1.90 credit and eight lots at a $1.95 credit. I added my put debit spread hedge at 1945/1920 for $5.65
I put the trade on in the middle of the trading day. Fills were at or near the mid-price and I didn’t have to wait very long to get filled…just a few minutes.
OptionVue Matrix

Rotating a Risk Chart
One of the reasons I like option trading is you can be so creative. Buying a stock or future is one of two lines: sloping up at 45 degrees or sloping down and -45 degrees. That’s it. With options, we have so much more flexibility.
I gave a presentation on option synthetics earlier this week and part of the presentation was about rotating a risk chart. It’s something I haven’t heard anyone else talk about. It’s how I think about what buying or selling the underlying does to an option position.
What do you mean rotate a position?
When I say rotate it means that you use the current underlying price as the pivot point and rotate the entire risk chart. Here’s an example.
Start with a simple bull put spread using the ES futures options. Selling a put and buying a lower strike put: