One of the reasons I like option trading is you can be so creative. Buying a stock or future is one of two lines: sloping up at 45 degrees or sloping down and -45 degrees. That's it. With options, we have so much more flexibility.
I gave a presentation on option synthetics last week and part of the presentation was about rotating a risk chart. It's something I haven't heard anyone else talk about. It's how I think about what buying or selling the underlying does to an option position.
What do you mean rotate a position?
When I say rotate it means that you use the current underlying price as the pivot point and rotate the entire risk chart. Here's an example.
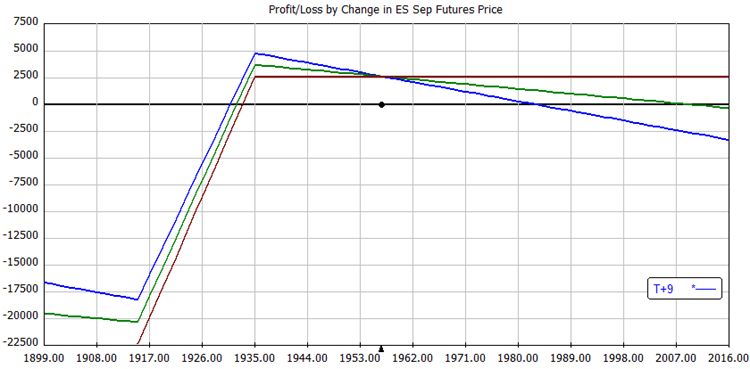
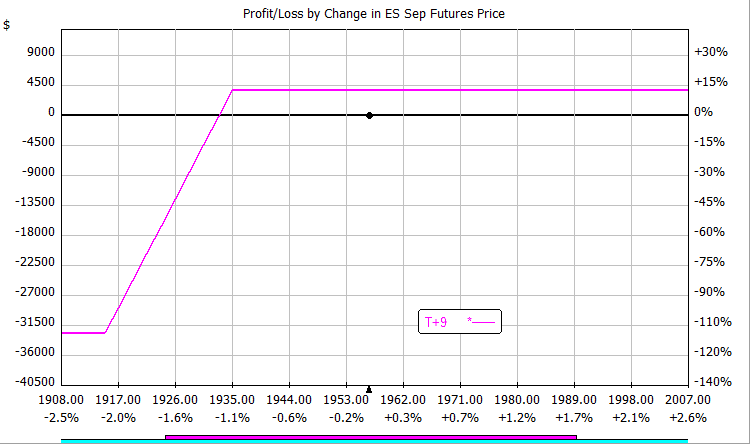
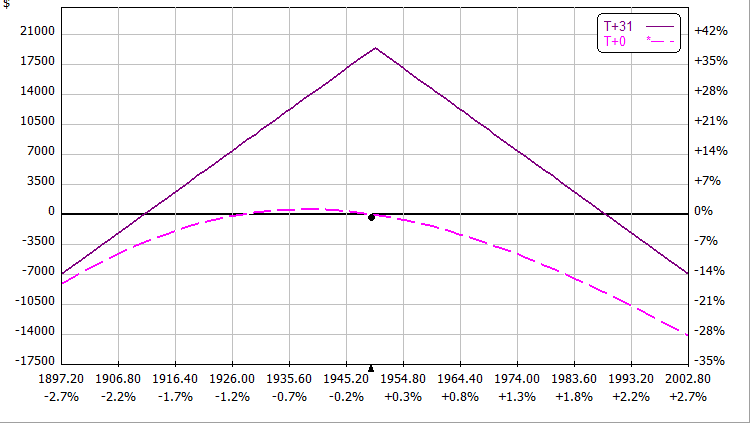
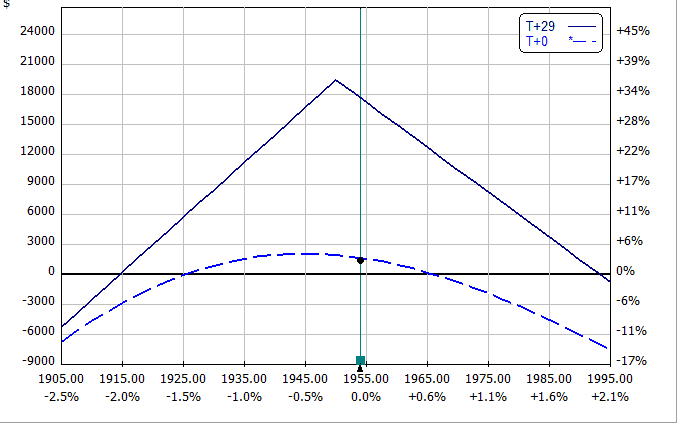
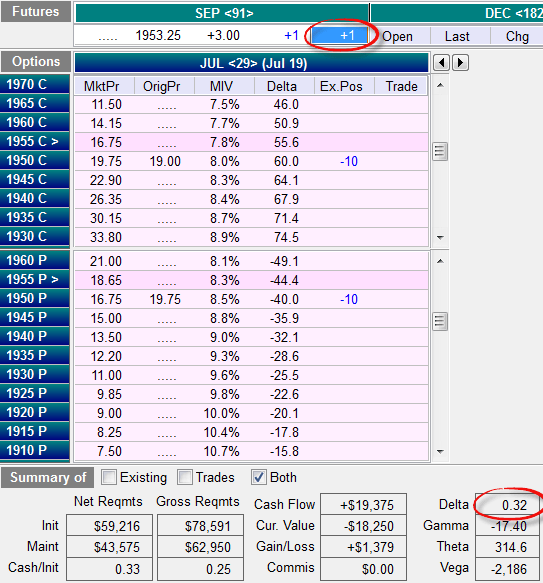
Start with a simple bull put spread using the futures options. Selling a put and buying a lower strike put:
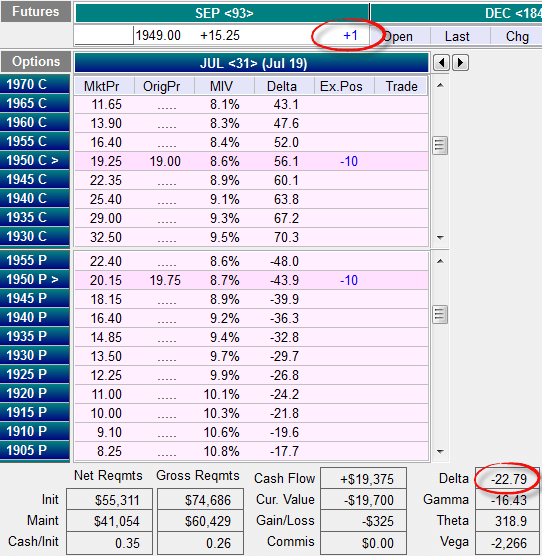
Let's sell one futures contract and examine what happens:
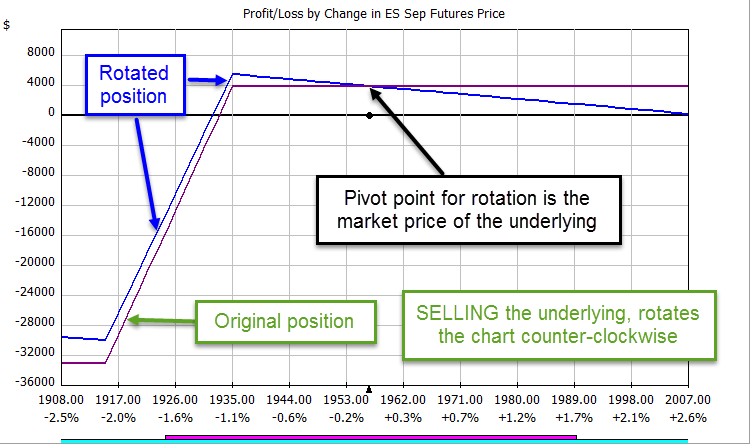
Notice how the entire position rotates around the current price.
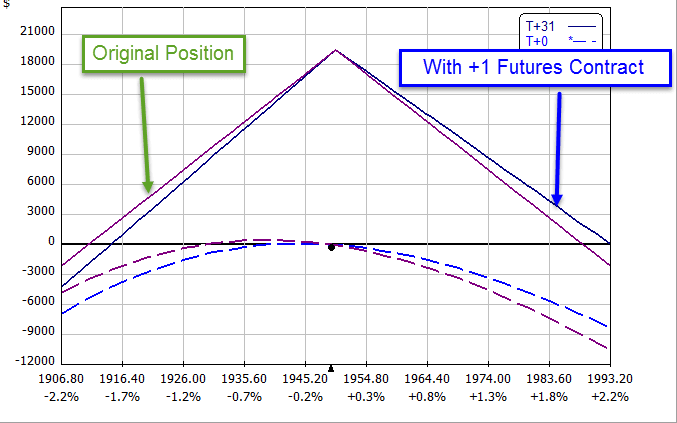
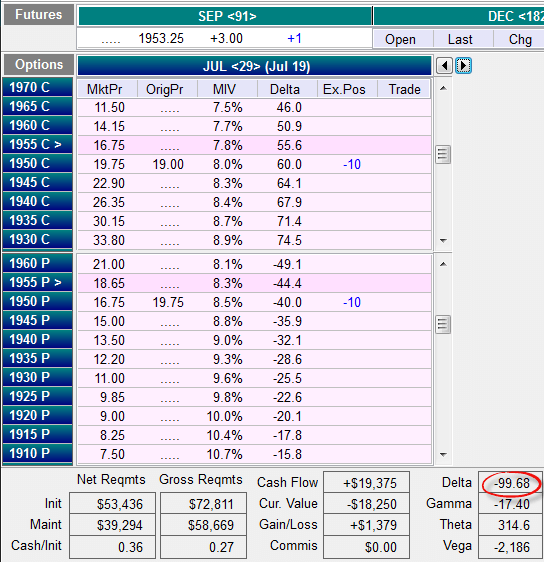
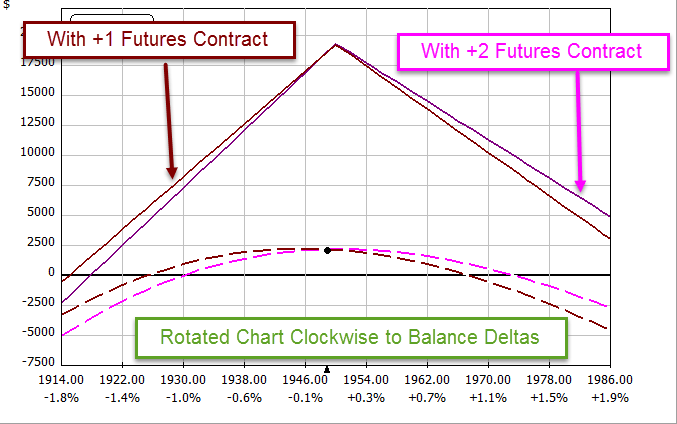
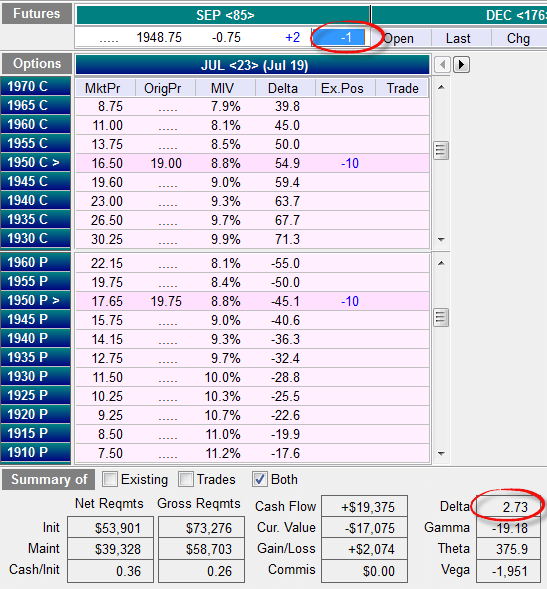
Let's add a second short futures contract:
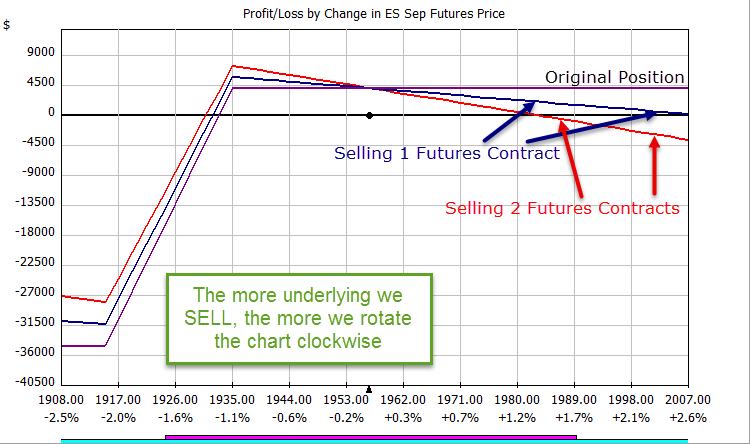
Notice how the amount of rotation is increased. You can use the the short futures or synthetic short futures to rotate the chart as much or little as you need.
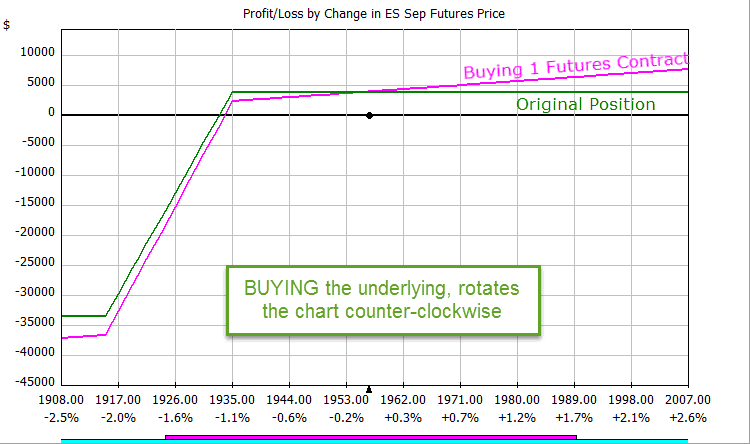
What happens when we buy the underlying?
The risk chart rotates counterclockwise. The more underlying positions you add, the more the angle of rotation increases. This example shows the same bull put spread we had before with addition of a long futures contract:
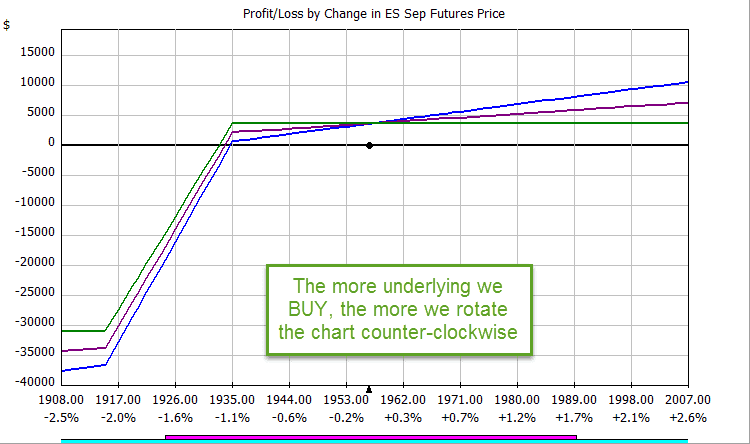
Notice how the risk chart is rotating more counterclockwise as we add more long futures contracts:
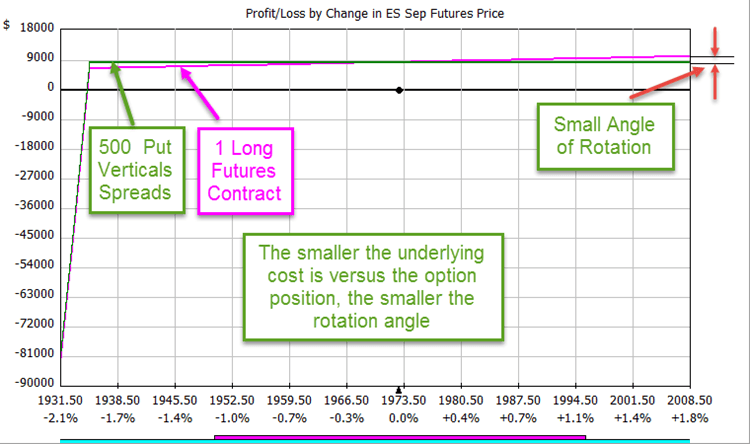
Controlling the Angle of Rotation
The angle of rotation depends on the margin of the existing position compared to the margin of the underlying used to rotate the position.
How Can I use this idea?
Suppose you like short straddles. You can balance the delta risk using the underlying by buying and selling it to adjust your position deltas. This example uses futures contracts and futures options, but you can do the same thing with stock. For buying/selling an index, you can use synthetic long or short underlying with option contracts.
Start with a ten lot short strangle using futures:
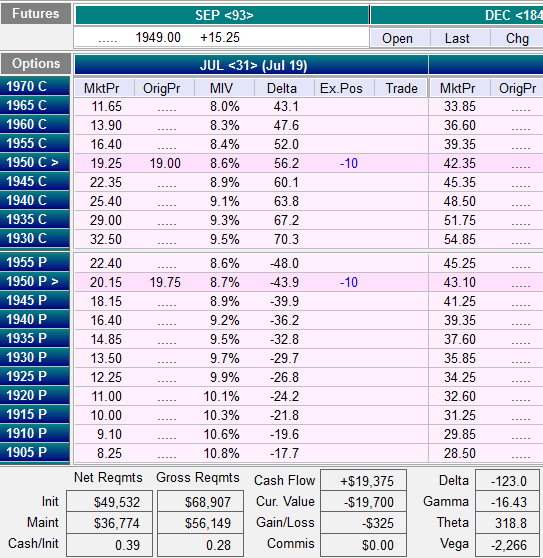
Notice the delta of -123.0. If we buy one futures contract and add 100 deltas, we cut the delta to -23 and rotate the risk chart:
If we go a few days in the future, the underlying has moved and changed our deltas again:
We can buy another futures contract to neutralize the delta again:
Now the underlying sold off and we need to correct our deltas the other direction. By selling one of our long futures, we correct our delta back to near zero again. Note that we lose a little on the futures contract we're selling as we bought it at a higher price; however, the theta makes up for the loss in the futures contract.
Summary
Buying or selling the underlying can be done with futures, stock or synthetically with options. The effect is to rotate the risk chart. The angle of rotation depends on the ratio of margin used for the underlying versus the margin for the rest of the position. Bigger positions have more granular control over the angle of rotation.
Are you using the underlying (or synthetic underlying) to modify your risk charts?