BLOG
What you don’t know about options synthetics CAN hurt you
I recently wrote a primer on option synthetics. To continue the discussion on option synthetics, I talked to Seth Freudberg at SMB Training about presenting for the Options Tribe about Option Synthetics. I'll be doing that on Tuesday, July 8th at 5:00pm ET.
The presentation will be for Options Tribe members but I'll try to get a copy of the recording for Capital Discussions. You can download the PowerPoint slides here.
Anybody Can Trade Options
My wife and I have suddenly become addicted to My Kitchen Rules and MasterChef Australia. Naturally, this has us constantly thinking about the cooking world and perhaps visiting Australia to partake of the outstanding food found there! I read a really good article on Usability from Dr. Jakob Nielsen’s Alertbox and couldn’t help notice the cooking analogy he used. I hope Dr Nielsen forgives the similarities and direct quotes from his article, but it occurred to me that trading options has a similar analogy.
Trading Options is like cooking dinner!
Is this the Market Top?
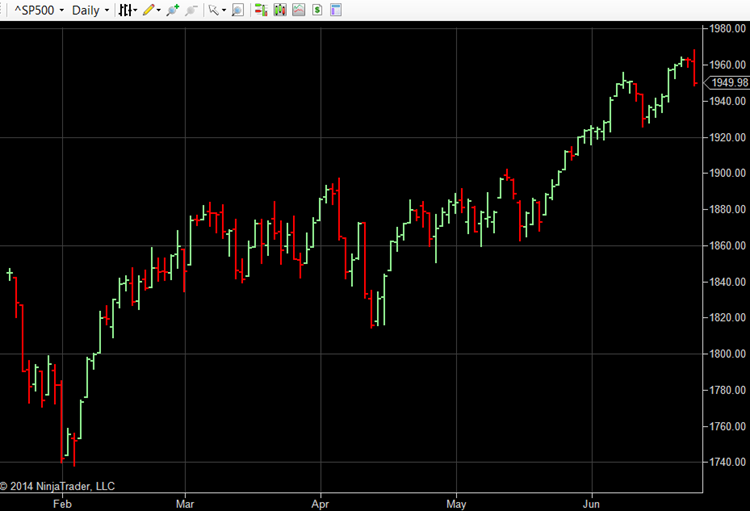
We've had some interesting discussions in our forums about the market topping. Garret is a long time Gann trader and showed us his charts that predicted the SPX topping on June 23 at 1959. The peak yesterday was 1968.17, one day off from Garret's prediction. Considering he did this a long time ago, it is very impressive!
Markets climb the wall of worry. In the face of an abundance of negative news, the markets keep climbing. At some point the markets will have a meaningful correction to the down side. Is this down move yesterday the start of the “big one?” No one knows.
SPX Jul 17 Broken Wing Butterfly
Time for a new trade in SPX. Another broken wing butterfly trade expiring on Jul 17th with 28 days to expiration. The eight lot of puts are at 1950/1930/1870. The 1930's were about a -22 delta. The trade was put on with a little smaller credit than I like, but it's enough to work with at 0.85 credit per spread.
I put the trade on at the end of the trading day. My last two spreads were filled less than nine minutes before the close. I didn't have time to analyze which put debit spread I wanted to put on so I'll see where the futures are going Sunday evening and make my plan for Monday.
Because I didn't have time to get my put debit spread on, the vega is a little higher, which the greeks calculator is warning me about. I should fix that first thing on Monday.

Trading Goals
John Locke published a good article on trading goals earlier today. Trader's commonly ask “what can I make each month trading?” Can I make $1000 per month? $5000 per month? What's my number?
This is really a question about what monthly yield or return want to make. How much capital you have and what your average yields are will determine what your average profits are.
We can't control the monthly returns. Those depend on what the market does and how we react to it and trade. Unfortunately, “monthly income” is only possible with a job or an annuity. Trading is neither one of these.
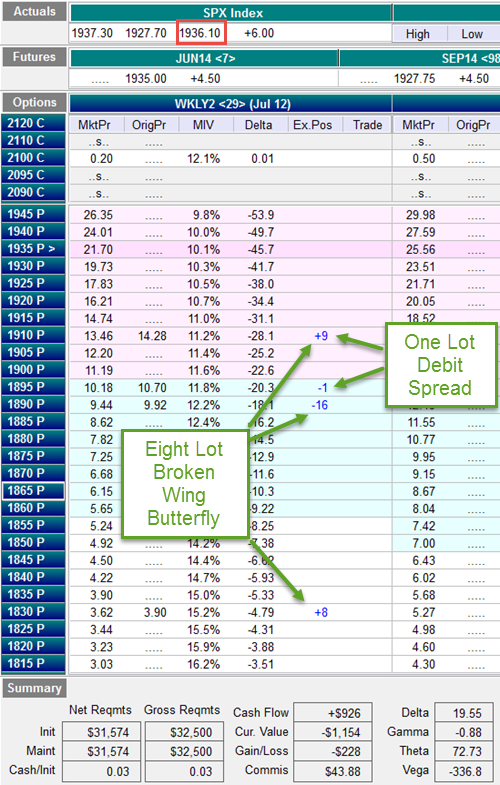
SPX Jul 11 Broken Wing Butterfly Trade Started
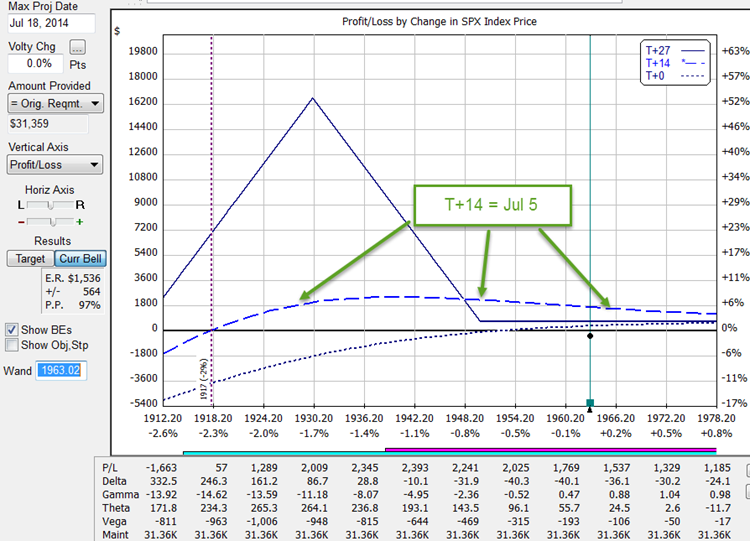
I put a new SPX Broken Wing Butterfly trade on yesterday with 29 days to expiration. It's an eight lot at 1910/1890/1830 with a put debit spread at 1910/1890 for a next credit of $926 on $31,574 of Reg T margin. That would be +2.93% in 29 days if held to expiration and SPX stays above 1910. If SPX sells off below 1910 and stays above 1867, it could have a much higher profit. Anything below 1867 at expiration would be a loss with the maximum loss of -$30,000 below 1830
The trade likely will not be held to expiration. The target for these types of trades is about 15 days into the trade, which has an excellent chance of being profitable.
Website Update: New Calendars Added
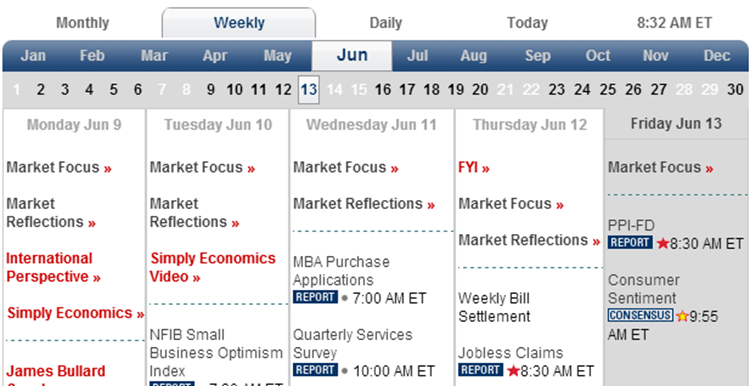
We added two calendars to help you plan your trading:
The Economic Events Calendar is for U.S. economic events only. If you trade currencies, you'll want to use an international calendar that includes events in the countries (or regions) you are trading. The calendar helps you plan by pointing out potential market moving events like the FOMC meeting announcements. It is important to check it before putting trades, especially weekly option trades that have more price risk built into them.
Sharp USDJPY Overnight Sell Off – US Equity Futures In The Red
In an article from Zero Hedge: http://www.zerohedge.com/node/489531
“… Unless, or course, central banks finally are starting to shift their policy, realizing that they may have lost controlto the upside since algos no longer care about warnings that “volatility is too low”, knowing full well the same Fed will come and bail them out on even the tiniest downtick. Which begs the question: is a big Fed-mandated shakeout coming? Could the coming FOMC announcement be just the right time and place for the Fed to surprise the market out of its “complacency” and whip out an unexpected hawk out of its sleeve?”
The S&P 500 Move Higher is Strengthening
This is an interesting post from Jim Riggio in our forums where Jim discusses his charts and why he thinks the S&P 500 up move is getting strong…
My “Momentum” charts are showing that the S&P's persistant move higher is strengthening.
As you have heard me say in the past… the Oscillators can live up here on the “ceiling” for longer then seems reasonable. This is the type of market (or stock prices) that Peter Lynch was referring to in his classic “One Up on Wall Street” when defining the most common mistakes that investors make… “The price has gone up this high. It can't go any higher.” Oh yes it can.
The Risk is Gone: VIX at a Seven Year Low
The VIX held above 11 most of the day yesterday but closed with a thud at the low for the day of 10.73!
The last time the VIX was below 11 was on Feb 23, 2007 when it closed at 10.58. On Jan 24, 2007, the VIX closed at 9.89. The lowest price I saw on a 14-year chart was Dec 22, 1993 when the VIX was at 9.31.