Today you will learn about a basic synthetic option position called the synthetic long stock position.
You can create a synthetic long stock position to replicate and replace buying stock outright. You also can create a synthetic short stock position to replicate and replace selling stock outright.
A synthetic long stock position is created when you purchase one at-the-money call option and sell one at-the-money put option at the same strike price and same expiration cycle. The position represents buying 100 shares of the underlying.
If you would like to create a larger position, the call and put options must be at a one to one ratio.
Both the synthetic long stock and the synthetic short stock strategy have the potential to reduce margin requirements for you.
A synthetic long stock position can be entered as a debit or a credit. Whether or not you pay a debit or receive a credit to enter the position can depend upon where the price of the underlying is trading in relationship to the option strike price you are using to create the position.
A Risk Graph is helpful to visualize the similarities between traditional long stock and synthetic long stock…
A Risk Graph shows many important items. One of those items is how the movement of the price of the underlying will affect the underlying’s value.
Do you want to learn more about the risk graph? If you do, here’s a risk graph tutorial from Think or Swim.
To understand the relationship between a traditional long stock position and a synthetic long stock position, let’s take a look at a risk graph showing each position.
Here’s a risk graph of AAPL traditional long stock…
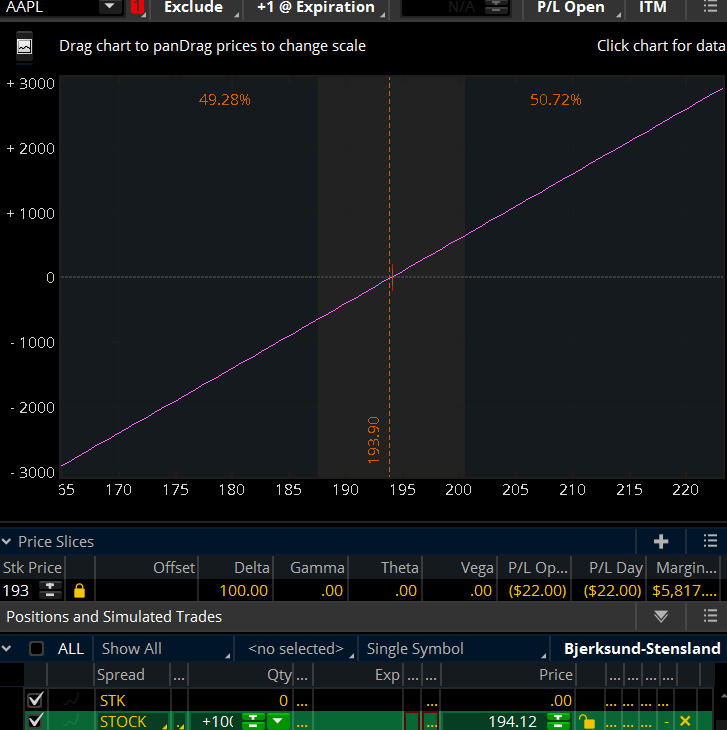
Figure A: 100 shares AAPL Traditional Long Stock
This risk graph is showing the price of AAPL is currently 193.90. Let’s assume you purchased the stock at the current price 193.90.
If the underlying price increases, it will be indicated on the diagonal red line. If the underlying stock stays above the 193.90 the stock position will show a profit.
If the underlying moves down below the 193.90 entry price, the long stock position will show a loss. This loss will be indicated on the red diagonal line.
You must include your commission costs to determine your actual profit or loss.
Here’s an example of a synthetic long position…
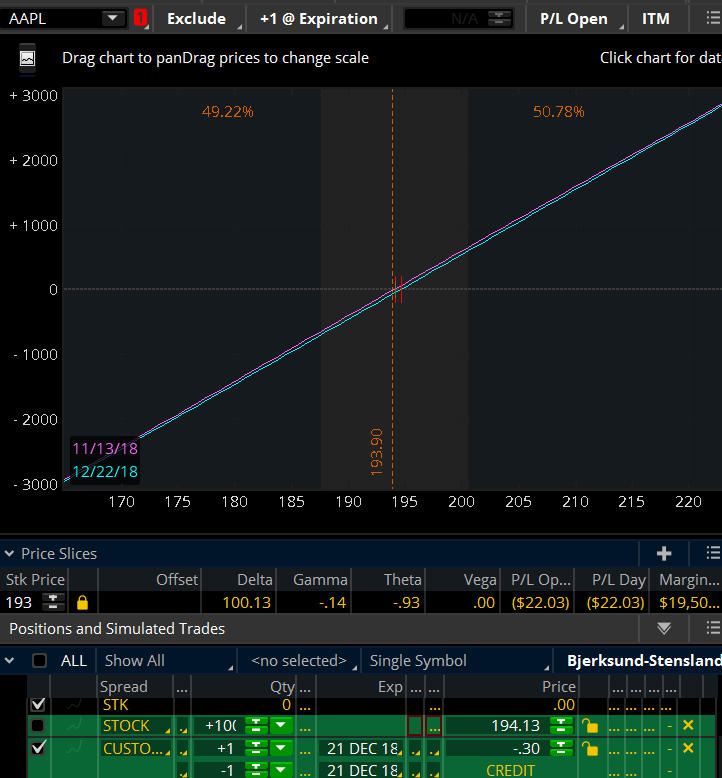
Figure B: AAPL Risk Graph Synthetic Long Stock Position
This is a risk graph showing an AAPL synthetic long stock position. This position was created by purchasing an at-the-money 21 DEC 18 195 long call option and selling an at-the-money 21 DEC 18 195 put option.
As you can see, both options have the same strike price and the same expiration cycle.
Please notice the diagonal line which indicates the profit and loss of the stock.
Do you see how the synthetic long option position has a similar risk profile when compared to the 100 shares of AAPL risk graph in Figure A?
How is a Synthetic Long Stock Option position constructed?
At the same time at the same strike price and the same expiration date;
- Buy 1 at-the-money (ATM) Call option
- Sell 1 at-the-money (ATM) Put option
How to calculate the profit of a synthetic long stock position is shown below:
There is unlimited profit potential up to the expiration date of the options.
- If the position is entered as a debit:
Profit = Underlying Price minus Strike Price of the Long Call minus the net debit you paid if the trade was entered as a debit minus commissions.
For Example:
110 (underlying price) – 105 (strike price) – $2 (debit paid) – $1 (commissions)
= $2 (profit)
- If the position is entered as a credit;
Profit = Underlying Price minus Strike Price of the Long Call plus the net premium/credit you received minus commissions.
For Example:
110 (underlying price) – 105 (strike price) + $3 (credit) – $1 (commissions)
= $7 (profit)
What is the potential risk in a synthetic long stock position?
Just as a traditional long stock positon, there is risk to you if the price of the underlying goes down after you have entered a synthetic long stock position.
If the underlying price goes to zero and the option cycle expires, you would lose all the money you paid to enter the position.
You will lose when the underlying price is lower than the strike price of the short put option.
How to calculate the potential loss of a synthetic long stock position is shown below:
- If the position is entered as a debit:
Potential Loss = Strike price of the short put option minus the price of the underlying plus the net premium you paid plus commissions.
For Example:
105 (strike price) – 100 (underlying price) + $3 (debit) + $1 (commissions)
= $8 (loss)
- If the position is entered as a credit:
Potential Loss= Strike price of the short put option minus the price of the underlying minus the net credit paid plus commissions
For Example:
$105 (strike price) – 100 (underlying price) – $3 (credit) +1 (commissions)
= $3 (loss)
What are the breakeven points for a synthetic Long Stock Position?
- If the position was entered as a debit:
Breakeven Point = Strike price of the long call option plus the net premium paid to enter the position plus commissions.
For Example:
$105 (strike price) +$2 (debit) +1 (commissions) = 103 (breakeven)
- If the position was entered as a credit:
Breakeven Point = Strike price of the long call option minus the net credit received to enter the position plus commissions.
For Example:
$105 (strike price) – $3 (credit) +$1 commissions) = $103 (breakeven)
Synthetic split-strike positions can also be created…
Synthetic long stock and synthetic short stock positions use at-the- money strike calls along with the same expiration at-the-money strike puts.
Synthetic split-strike positions can also be constructed and are discussed a little bit in this article:
Are Synthetics the same as owning stock?
One of the key differences between buying stock outright and creating a synthetic stock position is: an option has an expiration date of which you must be aware. It will expire. Stock does not have an expiration date.
If you own stock that pays dividends, you receive those dividends. If you create a synthetic position, you will not receive dividends. Options do not pay dividends.
In the United States, stock which you hold for a certain period of time may have tax advantages. A synthetic option position does not receive those same tax advantages.
Simulate buying or selling indexes using a synthetic long stock position.
Indexes such as RUT and SPX do not allow you to purchase the underlying outright.
You can create a synthetic position using options, which would be identical to buying or selling the underlying.
If you want to create a long position to simulate buying the index, you would buy an at-the-money call option and sell the at-the-money put option using the same strike price and same expiration.
If you want to create a short position which would simulate selling the index, you would buy the at-the-money put option and sell the at-the-money call option using the same strike price and same expiration.
Key Takeaways
- The synthetic long stock strategy is a bullish position.
- To create the position, purchase a call option and sell a put option at the same strike price in the same expiration cycle.
- The synthetic long stock strategy replicates buying 100 shares of stock.
- Maximum profit is unlimited.
- Maximum loss occurs if the stock goes to zero.
- One advantage to the synthetic long stock strategy is the margin requirements could be less than purchasing 100 shares of stock.
- An option has an expiration date of which you must be aware. It will expire. Stock does not have an expiration date.
If you have found a particular synthetic long stock position to be helpful or a hindrance in your trading please comment below. We can benefit from each other’s experiences good or not so good.