
You have heard the saying “Slow and steady wins the race.” Today we will discuss how low annual volatility in your trading returns can allow your profits to accrue without large swings in your overall portfolio.
For many traders, low annual volatility of returns creates a less stressful trading environment. Low stress can lead to better health and improve the overall quality of your life. Low stress usually allows you to “sleep like a baby”, otherwise known as “SLAB” trading.
Monitoring the annual volatility in your returns is critical in managing the risk of your investments. How the returns are calculated can lead to different annual return results. The two methods to calculate returns we will discuss today are the “Arithmetic Average” and an average return using volatility which some refer to as the “Geometric Average.”
What is the Arithmetic Average Return?
In short, the “Arithmetic Average”, or “Mean”, is the sum of a series of numbers divided by the count of a series of numbers”, according to Investopedia.
Arithmetic returns are calculated using a simple average over a period of time. Fund managers and mutual funds will often use arithmetic returns.
How can Arithmetic Returns be Calculated?
The spreadsheet below shows three traders each with a beginning account balance of $100,000. Trader A, B, and C all have the same arithmetic average return of 5% for the year.
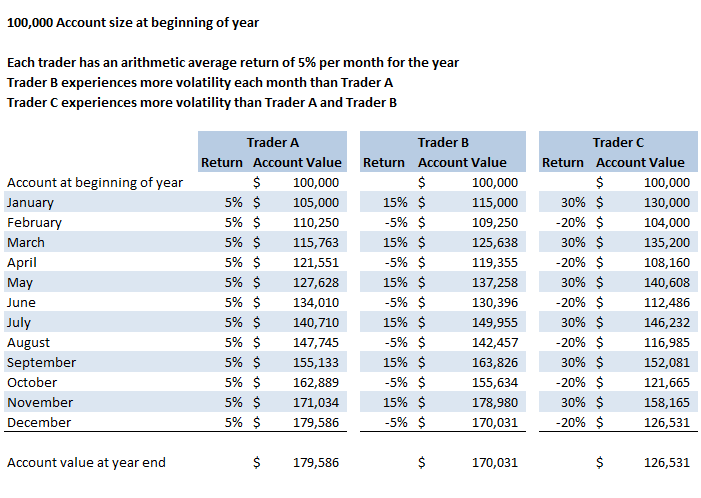
Example A. Annual Returns Arithmetic and Geometric (Includes Volatility)
In Example A, the calculation for the arithmetic return is achieved by adding each month's return and dividing it by the number of months. To calculate the arithmetic return for Trader A, the returns for each month are added together, which equals 60, and divided by the 12 month period, which equals a 5% arithmetic return.
Now let's look at Trader B's returns for the year:
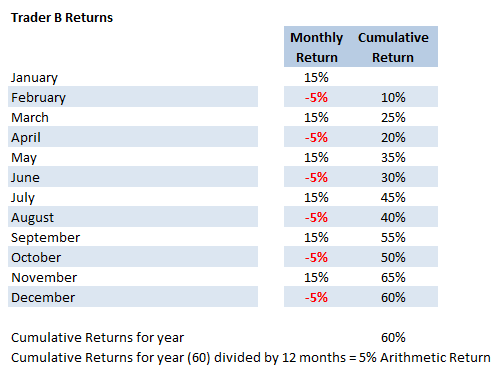
Example B. Trader B Arithmetic Return Calculation
As you can see in Example B, the arithmetic return for Trader B is also 5%.
Adding the monthly returns of Trader C also equals 60, and when divided by the 12-month period also equals a 5% arithmetic return.
However, arithmetic returns often do not show the true impact on the annual returns. The volatility of returns plays an important role when calculating the actual annual returns, as explained below.
Volatility calculations can lead to dramatically different average returns
Returns that factor in volatility can tend to be much more accurate than Arithmetic returns. When volatility is used, compounding is important.
When a loss is realized and applied towards the total capital in your trading account, it reduces your available trading capital. When a gain is realized and applied to your trading account, you then have more capital to trade. Including volatility in your returns can result in a different overall percentage return compared to an Arithmetic return.
How annual returns can be calculated including volatility
Trader B's returns are more volatile than Trader A's returns. Trader B's returns vary from +15% to -5% as shown in Example A.
Referring to Example A again, notice Trader B's account value starts with a balance of $100,000. In January, the account has a 15% positive return, building the account value to $115,000. In February Trader B's account has a loss of 5%. The $115,000 account is now reduced to $109,250. If you follow each subsequent month up to and including December, you will see Trader B's account value of $170,031 at the end of the year is less than Trader A's year-end account value which is $179,586. Trader B's account is more volatile than Trader A, which leads to the lower returns.
Now look at Trader C in Example A, which shows the returns of Trader C to be more volatile than Trader A and Trader B. As you follow the account value of Trader C from January to December, you will notice the ending account value is $126,531, which is less than Trader B's ending account value of $170,031, and less than Trader A's ending account value of $176,586. Once again, higher volatility resulted in a lower annual return.
Low annual volatility of returns can lead to more stable returns
As you have seen by the examples above, lower volatility of returns can result in a better annual return. There are less dramatic price swings from month to month, which leads to a more stable overall account value.
To see the volatility of returns for the educational services provided by Capital Discussions,visit https://members.capitaldiscussions.com/performance.
In summary
Arithmetic calculations of returns do not take into account the volatility of those returns. Arithmetic average returns tend to overstate the actual return. When a loss occurs, the result is less value in trading capital.
The more volatile the returns the more important it is to use volatility in the calculations. Low volatility of returns can play an important role in compounding your annual returns. It is wise to be aware of the volatility of returns on your trading strategies and overall portfolio. Remember for many traders, lower stress leads to a happier life. “Slow and steady wins the race.”
For a good video explaining Arithmetic vs. Geometric returns go to: Arithmetic vs Geometric Returns.
If you have additional resources you have found helpful to you in analyzing the volatility of your returns and would like to share, feel free to comment.
Are you looking for a network of like-minded traders who share their trade plan, wins, and losses? Capital Discussions can guide both the novice and veteran traders through mentoring programs, trading groups, educational trade alert services, and more. Join here: Capital Discussions