
I've written over recent weeks about a few of the numerous technical indicators available to traders. This week I will touch on the Williams %R oscillator. This oscillator was developed by well-known technical analyst Larry Williams. It is similar to the Stochastic oscillator, as it is also a momentum indicator. Like the Stochastic oscillator, the Williams %R indicator is used most by traders looking to identify market conditions that are oversold or overbought. The indicator is also used to note divergence of momentum from the price of the underlying.
As a general statement, any momentum indicator is a tool which can help predict future trends by using recent price and volume data on the underlying instrument. They allow a trader to see where the current price is relative to its historical trend.
Most charting software has the Williams %R study available for traders to overlay on their charts, so it is not necessary to manually calculate the formula. For informational purposes, the formula that is used to calculate the Williams %R indicator is below:
Williams %R = (high price of the period minus closing price) divided by (high price of the period minus the low price of the period) x -100.
Below is a 6-month chart from Think or Swim showing the Williams %R oscillator:
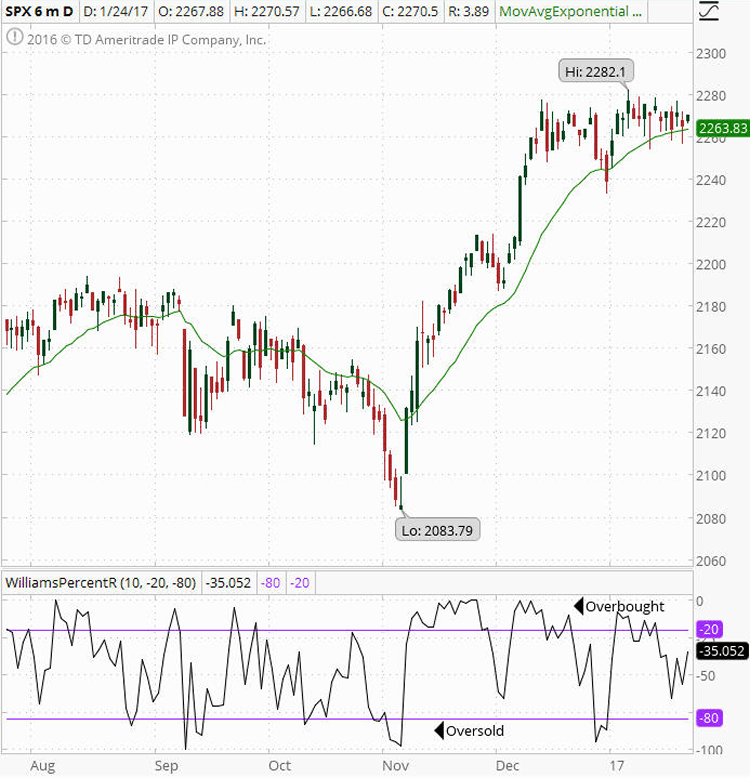
Figure A. SPX 6-month chart showing Williams %R
The default setting on TOS, as shown in Figure A above, is 10 time periods – or ten days in the case of this daily chart. However, the Williams %R oscillator can also be used on a variety of chart time frames. Readings for the indicator range from 0 to -100.
What do these Williams %R readings mean in the above chart?
Generally, readings between 0 and -20 are considered to indicate overbought levels, or when the underlying is near its high for the 10-day time period. Readings between -80 and -100 are usually indicative of oversold levels, or when the underlying is near its lows for the same 10-day time period. I have indicated recent overbought and oversold levels on the SPX chart shown.
How can traders use the Williams %R Oscillator?
The Williams %R oscillator is a fairly simple technical indicator, and can be helpful at times, particularly to directional traders. A typical example of how a directional trader may use the Williams %R would be as follows:
- First, identify the current price trend of the underlying you wish to trade, and then determine a trading strategy best suited to your trading style in the direction of the trend. The strategy may be as simple as a long call or put, or more complex positions such as vertical spreads, time spreads (calendars, diagonals), directional butterflies, etc.
- When the underlying is in an uptrend, look for oversold signals to consider opening a bullish position.
- When the underlying is in a downtrend, look for overbought signals to consider opening a bearish position.
- Once the underlying becomes overbought or oversold, it is important to wait for some type of confirmation that a price reversal has occurred before actually placing a trade based on the overbought or oversold levels. Just because the underlying has reached either level, it does not always mean that a reversal is imminent. It may remain oversold or overbought for a period of time before reversing.
As with any technical indicator, the Williams %R oscillator should be used in conjunction with other technical analysis such as support and resistance, volume, etc. Any one indicator that a trader chooses to incorporate into his/her technical analysis is not going to make you money unless you use it consistently.
Are you looking for a trading group, educational alert service, or perhaps a mentoring program? Look no more, go to capitaldiscussions.com where you will find a comprehensive list of programs that can be used in any type of options trading.
Tell us how you use Williams %R in your trading below.