
The broken wing butterfly (BWB) is an advanced strategy involving the use of multiple options. The butterfly strategy is generally thought of as a neutral to slightly directional strategy, which will often benefit when the market does not move too much in price.
A Broken Wing Butterfly has long strikes which are not the same distance from the short strike. One of the wings has greater width from the short strike. This results in one side of the position having more risk than the other side, which makes the broken wing butterfly slightly more direction than a traditional butterfly. The wing which has more distance from the short strike is called the “broken side”, thus the name broken wing butterfly.
There are many advanced traders who construct the broken wing butterfly in various ways to adapt to numerous market conditions. They will enter a trade, and then make adjustments to the position as market conditions change.
For the purpose of today’s discussion, we will be focusing on a basic broken wing butterfly.
First let’s take a brief look at a Traditional Butterfly…
The traditional butterfly can be constructed using call or put options.
The Traditional Call butterfly is constructed using each long option the same distance from the short strike. The distance from each long option strike to the short option strike is called a wing.
- Buy one call option above the short strike
- Sell two call options
- Buy one call option below the short strike
Here is an example of Traditional Call Butterfly with 20 point wing widths.
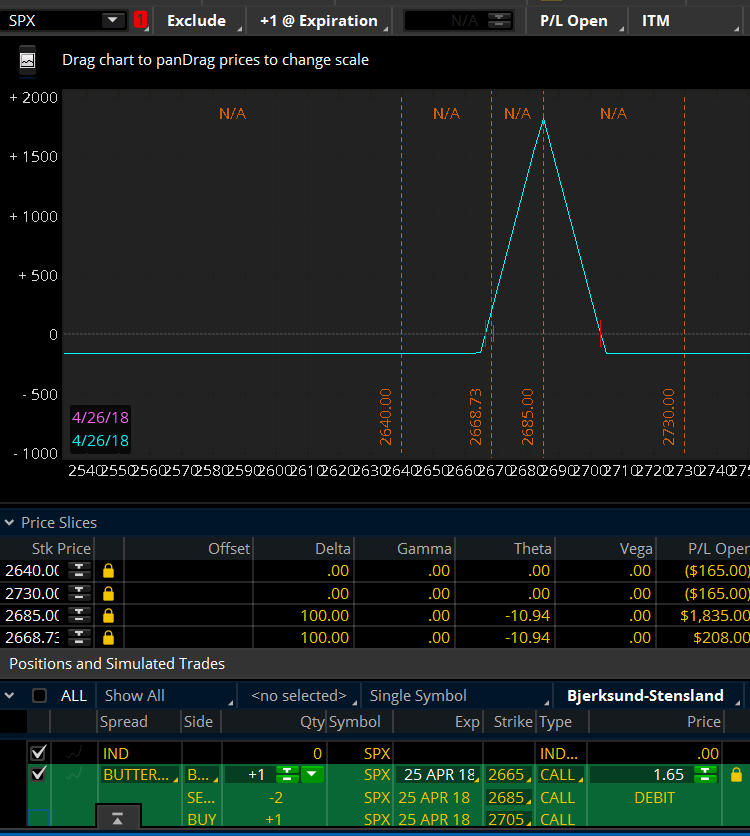
Figure A: SPX Traditional Call butterfly with 20 point wing widths
The price of SPX in this example is 2668.73. This traditional call butterfly has a 2665 lower long strike which is slightly In-the-Money. The two short strikes are at 2685. The upper long strike is placed at 2705. As you can see, both long calls are 20 points away from the short calls. The maximum loss on the trade at expiration to the downside, or left of the risk graph, is ($165.00), as shown by the 2640.00 price slice. The maximum risk, or loss, to the upside at expiration is ($165.00), as shown by the 2730 price slice. The maximum profit is $1835.00, which is at the 2685 short strikes, as shown by the 2685 price slice.
The Traditional Put Butterfly is constructed using each long option the same distance from the short strike.
- Buy one put option above the short strike
- Sell two put options
- Buy one put option below the short strike
Here is an example of Traditional Put Butterfly with 20 point wing width.
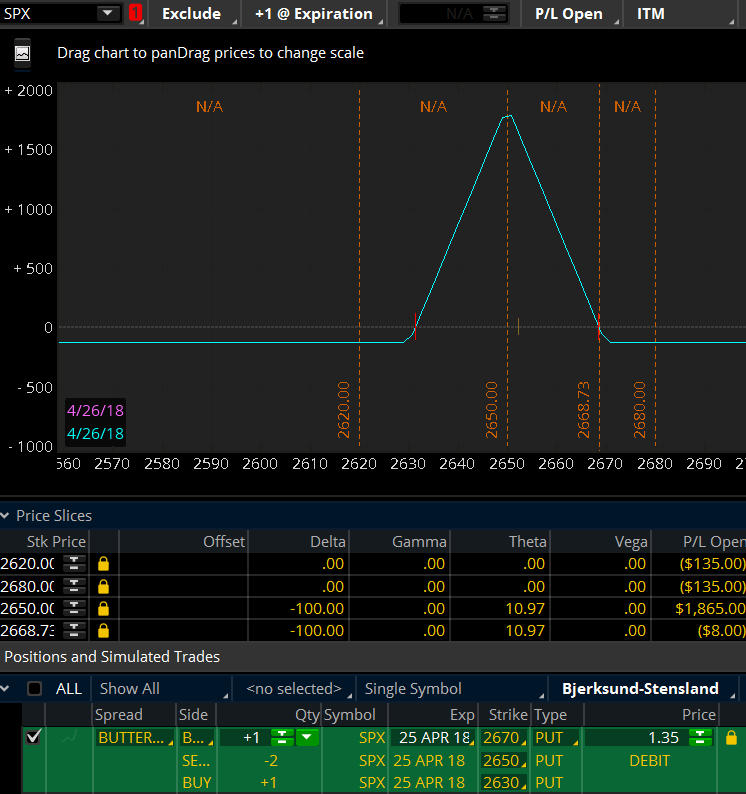
Figure B: SPX Traditional Put Butterfly with 20 point wing widths
The price of SPX is 2668.73 in the example being used. This traditional put butterfly has a 2630 lower long strike which is Out-of-the-Money. The two short strikes are at 2650. The upper long strike is placed at 2670, which is slightly In-the-Money. As you can see, both long puts are 20 points from the short puts. The maximum loss on the trade at expiration to the downside, or left of the risk graph, is ($135.00). This is the debit to enter the trade, as shown by the 2620.00 price slice. The maximum risk, or loss, to the upside at expiration is the debit to enter the trade ($135.00), as shown by the 2680 price slice. The maximum profit is $1865.00, which is at the 2650 short strikes, as shown by the 2650 price slice.
How is the Broken Wing Call Butterfly Constructed?
The Broken Wing Call Butterfly is constructed using each long option with different distances from the short strike.
There are numerous wing widths which can be used to construct a broken wing butterfly. Let’s explore an example of how a broken wing butterfly could be constructed with call options having 20 and 30 point wing widths.
- Strike A: Buy one call option 20 points below the short strike
- Strike B: Sell two call options
- Strike C: Buy one call option 30 points above the short strike
The scenario we are discussing here assumes you are mildly bullish and thinks the price of the underlying asset will move up in price gradually. Strike A is purchased at, near, or slightly In-the Money in relation to the underlying price of the asset. This means you would want the price of underlying asset to move up towards the short strike. Option strike B and option strike C are Out -of- the Money when the trade is first entered.
The trader’s goal is to profit from the price of the underlying moving up in a gradual manner. The trader is not looking for a large, fast move in the price of the underlying. The trader is looking for both call option strikes B and C to decay in value towards zero. This would potentially allow the trader to realize a profit from Strike A.
Here’s an example of a Call Broken Wing Butterfly with 20 and 30 point wings…
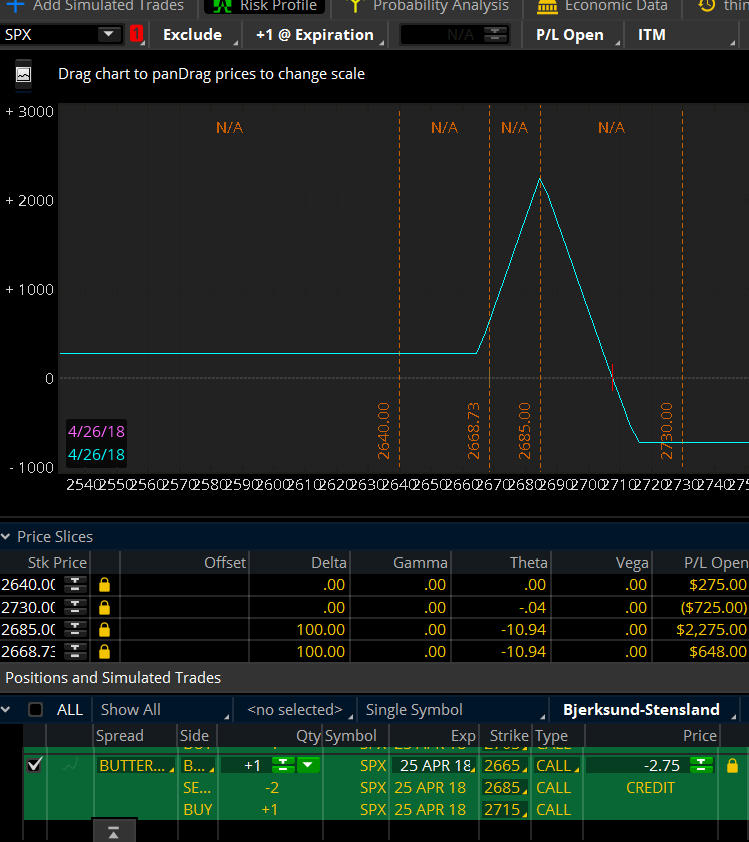
Figure C: SPX Call Broken Wing Butterfly with a 20 point wing and a 30 point wing
This broken wing call butterfly has a 2665 lower long strike, which is slightly In-the-Money with a 20 point wing. The two short strikes are at 2685. The upper long strike is placed at 2715, creating a 30 point wing. There is no risk to the downside on this trade, as shown by the 2640 price slice. The position at expiration to the downside, or left of the risk graph, is a positive $275.00. This is the credit received when the trade was entered. The maximum risk, or loss, to the upside at expiration is a loss of ($725.00), as shown by the 2730 price slice. The maximum profit is $2275.00 which is at the 2685 short strikes, as shown by the 2685 price slice. There is greater risk and a greater profit potential with the broken wing call butterfly, as compared to the traditional call butterfly.
The Peak of the Broken Wing Butterfly
When you look at the risk graph of a broken wing butterfly, you will notice a peak. With a somewhat bullish call option position, a trader will make money as the price of the underlying moves in the direction of the peak of the risk graph. The trader makes money in this call BWB when option strike B and C decay in value and option strike A retains or gains value. The trader’s goal is for the price of the underlying asset to not go past the two B option short strikes.
With a mildly bullish call BWB position, the price of the underlying is many times at or near option strike A. Remember, strike A is a long call option position, because the trader purchased the option.
At option strike B, the trader is short two calls. Those two short calls represent the peak of the risk graph. The two short calls are sold by the trader. The trader is selling two call options.
The center point, or peak of the risk graph, is where the maximum profit would potentially occur. For the most part, gaining the maximum profit at the peak of the risk graph at expiration will rarely happen. But, when the price of the underlying is inside the triangle of the risk graph, there is potential profit which could be realized. This is a large area for potential profit, which could tend to increase the probability of a profitable trade.
Broken Wing Butterfly using Put Options…
Now let’s look at an example of a broken wing butterfly using put options with 30 and 20 point wings.
- Strike A: Buy one put option 30 points below the short strike
- Strike B: Sell two put options
- Strike C: Buy one put option 20 points above the short strike
The trader is mildly bearish on the underlying asset. The trader’s goal is for the underlying price to move down from option strike C towards the center option strike B.
The trader’s goal is to allow option strike A and option strike B to decay towards zero which would allow a profit on option strike C.
Here’s an example of a SPX Put Broken Wing Butterfly with 30 and 20 point wings…
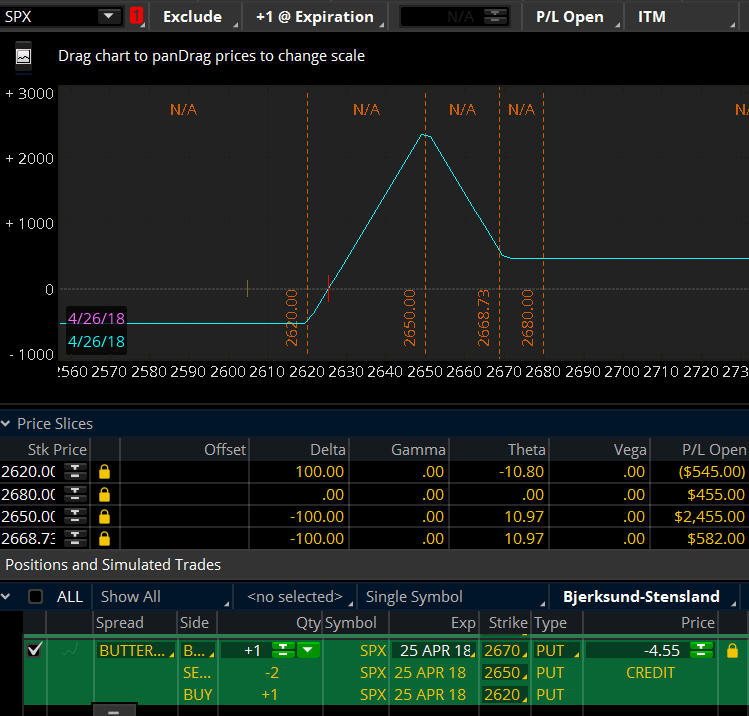
Figure D: SPX Put Broken Wing Butterfly with a 30 point wing and a 20 point wing
This broken wing put butterfly has a upper long strike at 2670, which is slightly In-the-Money with a 20 point wing. The two short strikes are at 2650. The lower long strike is placed at 2620 creating a 30 point wing. There is no risk to the upside for this trade, as shown by the 2680 price slice. The position at expiration to the upside, or right of the risk graph, is a positive $455.00. This is the credit received when the trade was entered. The maximum risk, or loss, to the downside at expiration is a loss of ($545.00), as shown by the 2620 price slice. The maximum profit is $2455.00 which is at the 2650 short strikes, as shown by the 2650 price slice. There is a greater risk and a greater profit potential with the broken wing put butterfly, as compared to the traditional put butterfly.
Wrapping it up….
The broken wing butterfly has more profit potential, but also has more risk as compared to a traditional butterfly.
Learning this strategy can take some time for someone who is new to options trading. It is important to learn this broken wing butterfly using a simulator or paper account. This allows you learn how the strategy reacts to a variety of market conditions. The volatility and price of the underlying asset can change quickly, which can affect the profit and loss of a broken wing butterfly.
There are numerous methods to construct and then manage a broken wing butterfly. As always, it is your responsibility as a trader to learn a method which is within your risk tolerance. It is easy to say” I can handle it” and be comfortable with a particular possible loss when you are in a paper account. When you switch over to using real money and you have a loss, it can be a different story.
It often becomes hard for a trader to accept a loss emotionally. This can lead to poor risk management. The trader may not take the loss and stay in a particular position hoping the profit and or loss will improve. Sometimes this works, but other times it does not work. It can be better to take the loss so the account does not take a big loss.
There are many experienced traders in the Aeromir Community who trade the broken wing butterfly. Please feel free to leave a comment below.