Gamma, one of the options “Greeks”, is often referred to as the Delta of the Delta. Gamma is the rate of change in the delta of an option per a one-point move in the underlying instrument. It is important for traders to understand the effect Gamma can have on their positions. As Gamma increases, it can dramatically affect a position in terms of its profitability.
To define and provide an understanding of Gamma, we will first touch on Delta. Delta measures the price movement of an option with a $1.00 movement in the underlying. If an option has a .38 Delta and the underlying instrument moves $1.00, the option price theoretically would move $.38 in value. Thus, the new option price would theoretically be $1.38.
What is long Gamma?
When you purchase an option, either a call or put, it creates long Gamma. If you are long Gamma and the underlying instrument increases in value, the Delta of the option strike will theoretically increase by the amount of your Gamma for every $1.00 move in the underlying instrument. If the underlying's price decreases, the Delta of the option strike would theoretically decrease by the amount of the Gamma for every $1.00 movement in the underlying. So, if the underlying's price increases and you are long Gamma, your Delta would theoretically increase. The opposite occurs if the underlying price decreases and you are long Gamma – your Delta would theoretically decrease.
What is short Gamma?
When an option is sold, you are short Gamma. When a position is short Gamma and the price of the underlying increases, the position Delta would decrease. Conversely, if a position is short Gamma and the price of the underlying decreases, the Delta of the position would increase.
How Gamma and time are related…
Time affects Gamma.
The closer an option gets to its expiration, the higher the Gamma. An option's Gamma is highest in the nearest term expiration cycles. Gamma is also highest for options at-the-money or near-the-money. As with many aspects of trading, there are exceptions to this which I'll discuss later on. Gamma tends to decrease as the underlying's price moves away from the at-the-money strike. As the price moves further in-the-money or further out-of-the-money, the Gamma tends to decrease.
Let's use Figures A and B below with SPY as an example to illustrate the affect time has on Gamma. Below are two option chains for SPY; 7 September which is 2 days until expiration, and 19 October which is 44 days until expiration.
SPY is currently trading at 289.64, so the 290.00 strike is at-the-money for the October 19 cycle, and the 289.50 strike is at-the-money for the 7 September cycle.
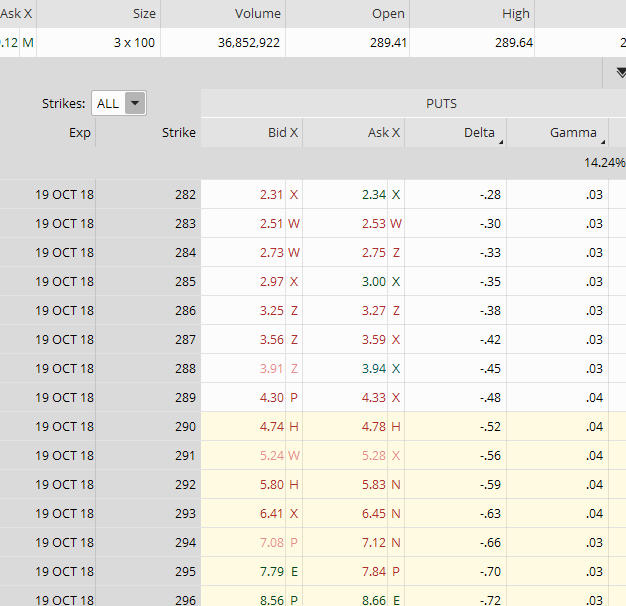
Figure A. SPY Put Option Chain 44 Days to Expiration, SPY currently trading at 289.64.
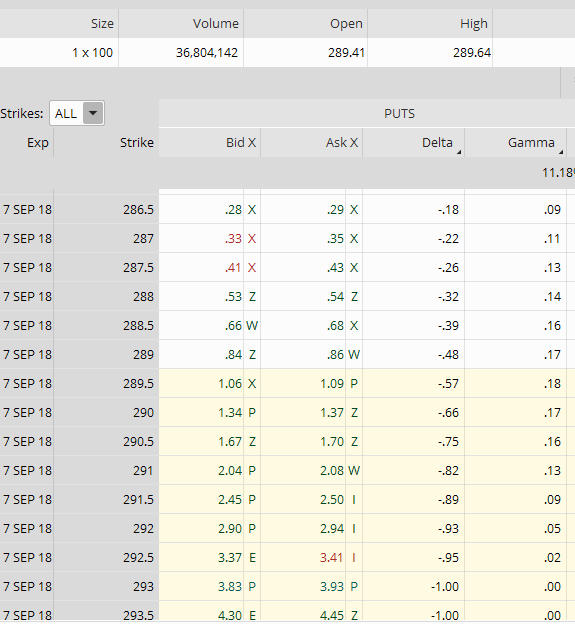
Figure B. SPY Put Option Chain 2 Days to Expiration, SPY currently trading at 289.64.
Refer to the Gamma column in Figures A and B to see how Gamma is affected by time. Also notice the relationship of Gamma at-the-money, and further out-of-the-money. Do you see how it tends to be higher at-the-money? Do you see how Gamma tends to decrease as it moves away from the at-the-money strikes?
As I said earlier, there are exceptions to the effect of Gamma over time …
What are the exceptions? At times, the back period expirations can have higher Gamma than the near-term expirations. This may occur because options that are very deep-in-the-money act like the stock itself, and stock itself has no Gamma.
It's important to understand how Gamma can affect a position which is composed of multiple options…
As shown in the SPY option chains in Figures A and B above, each option strike has it's own Gamma. Most trading platforms combine the Gamma for each option, and calculate the long and short Gamma to determine the overall Gamma of a position composed of multiple options.
Many traders manage their positions according to Gamma, and feel that Gamma can be a measure of how often a position may need adjusting. They do this by looking at the T + 0 line (the black, curved line in Figures C and D below) You can get a visual of Gamma on most platforms when you view a risk graph. Is the T + 0 line relatively flat or is it curved? If your T + 0 line is flat or only slightly curved, your position will have less Gamma. If it is steeply curved, your position will have higher Gamma.
Using SPY again, see the two Iron Butterfly positions in Figure C and D. We will use the same expiration cycles as in the option chain example above … September 7, which is 2 days to expiration, and 19 October which is 44 days to expiration.
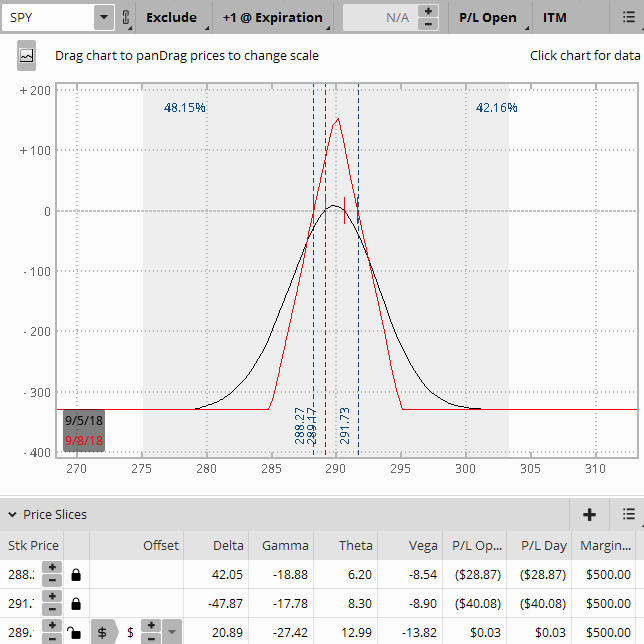
Figure C. SPY Iron Butterfly 2 Days to Expiration (sharply curved T + 0 line)
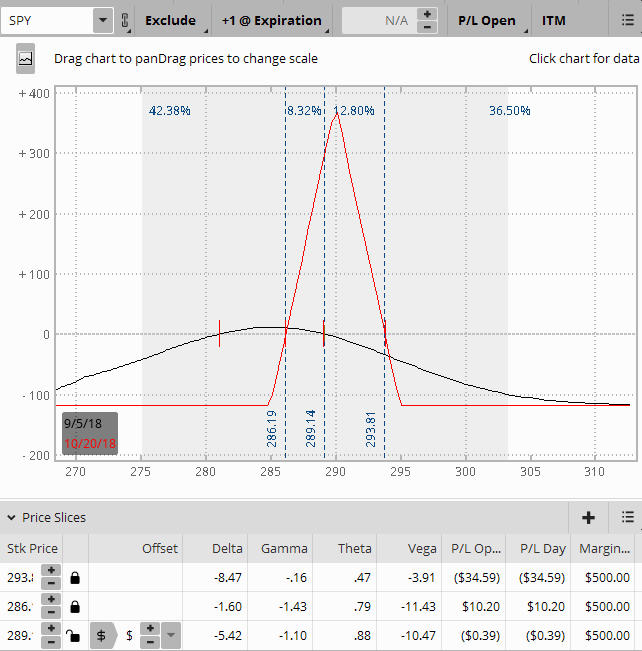
Figure D. SPY Iron Butterfly 44 Days to Expiration (flatter T + 0 line)
The two positions shown above in Figure C and D are for an at-the-money Iron Butterfly, which consist of: Short the 290 call strike, long the 295 call strike; short the 290 put strike, and long the 285 put strike.
In Figure C, with only 2 days until expiration, the Gamma is -27.42, whereas the position Gamma in Figure D which has 44 days until expiration is only -.1.10. See how steep the curve is on the T + 0 line (black, curved line) in Figure C versus Figure D?
Those who trade shorter term positions such as weeklys take on the potential of a higher profit, as well as the risk of a larger loss on their positions with even the smallest move in the underlying. This is mainly because of Gamma. More conservative traders who trade longer-term positions such as the one in Figure D have less potential risk of a major profit or loss, at least early in the trade, due to the lower Gamma.
Summing it up…
It can be confusing at times, particularly for those traders with less experience, to remember the characteristics and relationships of an option's Gamma and Delta. An easy way to remember them is:
• Positive Gamma makes Delta more and more positive as the underlying price increases.
• Negative Gamma makes Delta more and more negative as the underlying price increases.
Gamma, like the other option Greeks – Delta, Theta, Vega, and Rho, is a metric that can be used to measure the level of risk for a position or portfolio. While Delta is often used as the Greek that affects a position's profit and loss as the underlying price moves, Gamma is a metric that a trader can use to gauge how much the Delta may move.
If you have any additional insights to Gamma and how you use it to manage your positions and would like to share, feel free to comment below.
Whether you are new to trading, or an experienced trader looking to fine-tune your craft, the Aeromir community is here to help you. There are trading groups where you can share your trades, educational trade alert services, mentoring, and more. Don't hesitate, join today!