
Because trends are composed of a series of price swings, momentum can play a key role in determining the strength of the trend. It is important to know when a trend may be slowing down, as it may be indicative of a reversal. How can a trader assess the strength of a trend? Using momentum, along with rate of change and momentum divergence, can signal something may be changing. This could mean that the trend may consolidate, or even reverse.
Price movement refers to the direction and magnitude of price. By comparing price swings, a trader may gain insight into price momentum.
How is momentum defined?
The magnitude of price movement is measured by the length of the short-term price swings. The beginning and end of each swing is established by price pivot points, which form swing highs and swing lows. Strong momentum is indicated by a steep slope and long price swing. Conversely, weak momentum is exhibited by a shallow slope and short price swing.
There are several momentum indicators such as the Relative Strength Index (RSI), Stochastics, and Rate of Change (ROC). The examples we will be using are analyzed with the Rate of Change Indicator.
Below is a six month chart of SPX with the Rate of Change Indicator.
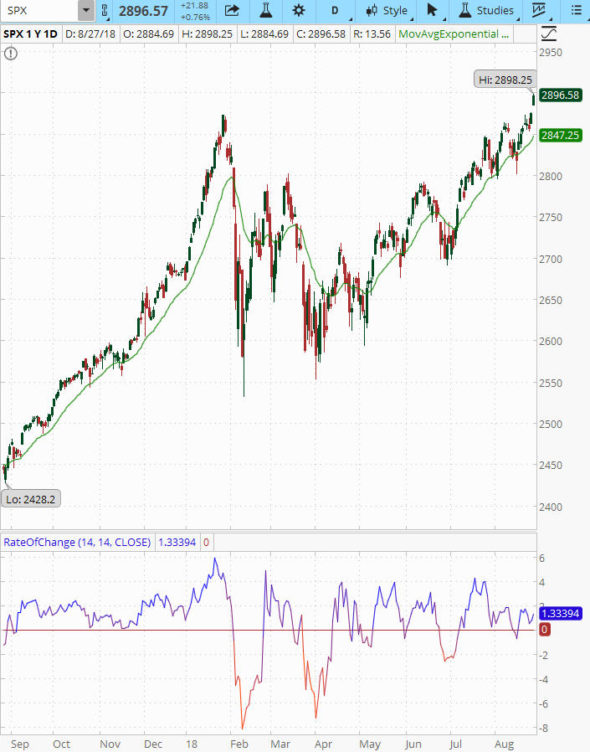
Figure A. SPX 6 month chart with Rate of Change Indicator
As you can see in Figure A, for each upswing in price, there is a similar upswing in the Rate of Change (ROC). When price swings down, ROC also tends to swing down.
What is the calculation for Rate of Change?
ROC = Today's price divided by price X days ago.
The default settings for Rate of Change calculation on Think or Swim as shown in Figure A above are:
• Length – the number of bars used to calculate the Rate of Change. Think or Swim uses 14-days as the default.
• Color norm length – the number of bars used to calculate the color gradient. In Figure A above, this is also 14-days. You can see the gradual change from red to blue as the price changes.
• Price – This is the price used in the calculation of Rate of Change
In Figure A above, the default setting on Think or Swim is the closing price. Traders have a choice of other prices such as open, high/low divided by 2, high/low divided by 3, volume, etc.
In the case of Figure A above with the default settings as outlined, the rate of change divides today's closing price by the closing price days 14 days prior. If both values are equal, ROC is 1. If today's price is higher, then ROC is greater than 1. Conversely, if today's price is lower, then ROC is less than 1.
Many traders find oscillators such as ROC are most useful using narrow time frames, detecting potential short-term changes in the market, perhaps within the time frame of a week. Other indicators that are trend-following are most often better used for longer-term trends.
What Rate of Change means for traders …
In general, when ROC is rising, it indicates a bullish market and prices are likely to continue higher. When ROC is falling, the outlook becomes bearish and lower prices could be likely.
When prices rise but momentum or ROC falls, this is called momentum divergence, which we will discuss next.
What is divergence?
Divergence is usually associated with an oscillator indicator. For the purpose of this discussion, we will continue to use the Rate of Change indicator. Many traders use divergence to aid in their decisions for new trade entry, adjustments, or exit.
Divergence in technical analysis can occur when the price of an underlying and an indicator are moving in the opposite direction of each other on a price chart.
• Bullish divergence occurs when the underlying price is moving lower as the indicator moves higher.
• Bearish divergence occurs when the underlying price reaches a new high, as the indicator moves lower.
Either bullish or bearish divergence may be a signal of a shift in the direction of the price of the underlying.
You can see an example of both bullish and bearish divergence on the charts below:
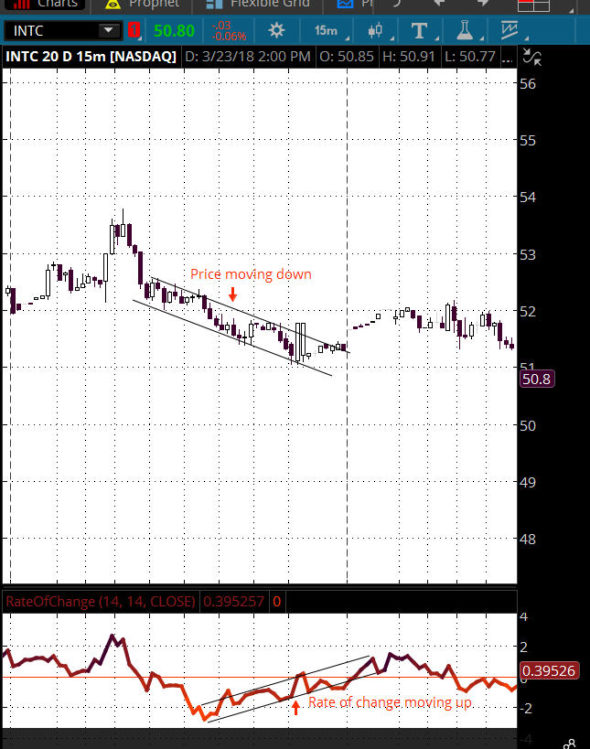
Figure B. Bullish Divergence chart from Think or Swim
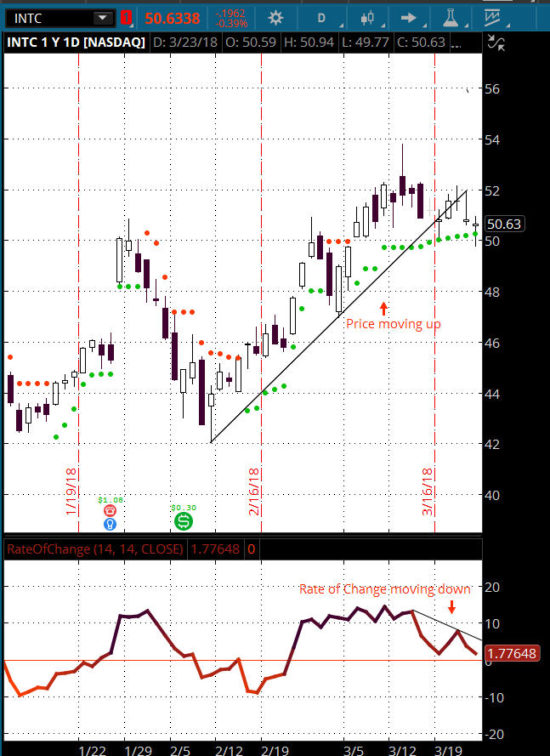
Figure C. Bearish Divergence chart from Think or Swim
How can traders interpret divergence?
Bullish, or positive, divergence can be a signal the downtrend may be weakening. Traders may interpret the lower lows in price while Rate of Change makes higher lows to be an indication a rally is forthcoming. This may be a signal to go long and enter a bullish position.
Bearish, or negative, divergence could be a signal the uptrend may be weakening. Traders may interpret the higher lows in price, while Rate of Change makes lower lows, to be an indication a downtrend may be forthcoming. This may be a signal to go short and enter a bearish position.
In conclusion …
The momentum indicators can be powerful indicators that can guide the trader on not only the market's future direction, but also the speed of the direction. It is important to note that there must be price swings of sufficient strength to make momentum analysis valid. When the market is in a strong trend in either direction, oscillators tend to not function all that well.
Momentum divergence can indicate that something is changing, but it does not mean the trend will always reverse. It is a signal a trader could consider to make modifications to his/her strategy…trade entry, adjustment, and/or exit.
Those using the Rate of Change or other momentum indicators should do so in conjunction with other technical analysis such as price action, support and resistance, volume, etc. Also, any one indicator a trader chooses to incorporate into his/her technical analysis is not going to make you money unless you use it consistently.
If you have found the momentum indicators to be particularly helpful in your technical analysis and would like to share, please comment below.
Whether you are new to trading, or an experienced trader looking to fine-tune your craft, the Aeromir trading community is here to help you. Don't hesitate. Join today!
They have a wide variety of programs including mentoring, educational trade alert services, trading groups, and veteran traders willing to share their trade techniques. When you surround yourself with consistently profitable traders, your own trading can improve.
