BLOG
Market Analysis for Apr 20, 2015
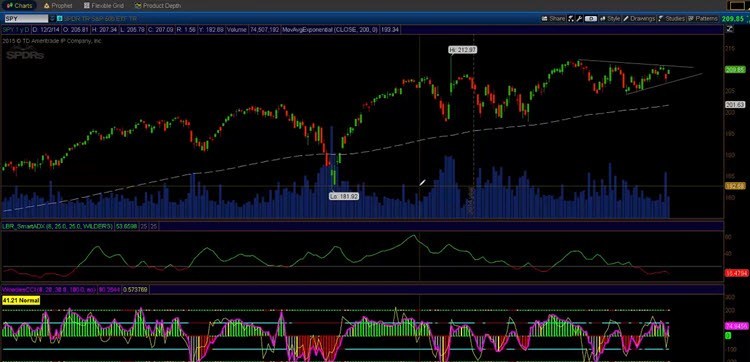
Jerry Furst from Traders Education Network hosted the meeting. Jerry covered recent market action including technical analysis of Fibonacci lines and chart. Himanshu Raval showed his Woodie's CCI analysis of SPY and IBM
REPLAY: Round Table with Bill Ghauri
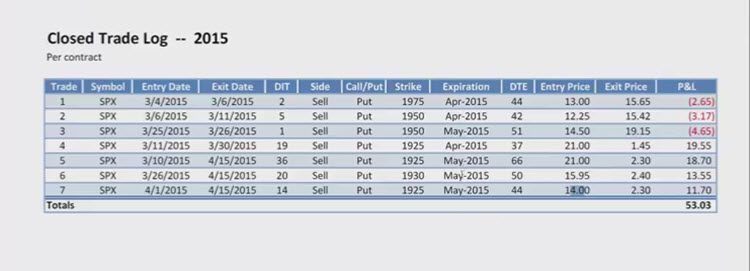
Bill Ghauri presented his new “Alpha Service” where he will provide real time trading alerts to follow his live trades. Bill does extensive automated testing and analysis and is focused on risk management and money management. In Bill's trading, losses are small and wins create a very nice equity growth chart. The Expectancy of his recent trades is over 2.0! Visit http://a.capitaldiscussions.com/bill-alpha-service/ for information about Bill's new service.
Enjoy the replay!
REPLAY: Round Table with Steve Lentz
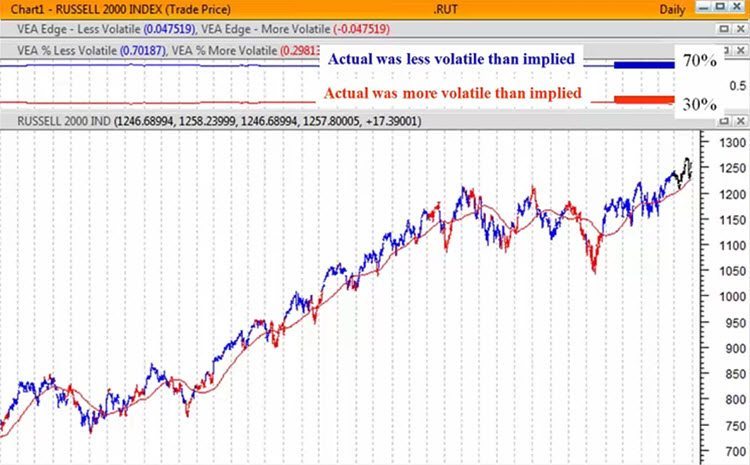
Steve Lentz, from OptionVue and Discover Options, presented “Volatility Edge Analysis of the Russell 2000.” Steve's data was very intriguing and showed how ofter option sellers have an edge on in the RUT. Steve is trying to use technical analysis to improve the edge and his results are promising.
Enjoy the replay!
Market Analysis for Apr 6, 2015
Jerry Furst from Traders Education Network hosted the meeting. Jerry covered recent market action including technical analysis of Fibonacci lines and chart
REPLAY: Round Table with Steven Place
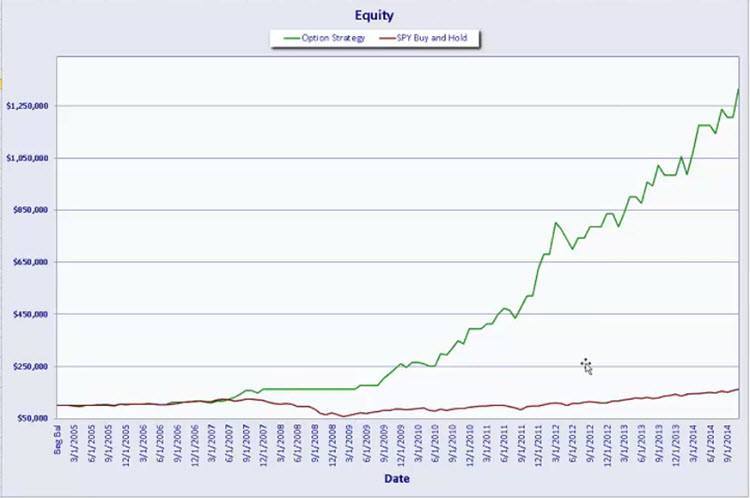
Round Table with Bill Ghauri. Bill presented his Long and Short trading systems using his automated back testing solution. Bill reviewed the importance of risk and money management in trading and sizing your trades correctly. Bill showed his backtesting tool in action and how his long and short systems use the 200 day moving average to guide trade entry. Bill also showed why selling iron condors is almost always a bad idea. Several attendees commented on how much they liked the presentation.
Enjoy the replay!
Market Analysis for Mar 30, 2015
Jerry Furst from Traders Education Network hosted the meeting. Tom entered a bearish EURUSD futures options trade and Jerry analyzed the price action of the 6E futures contract. Jerry showed his “Sell in May and Go Away” analysis and Jim talked about theta decay and how it's different in puts and calls at different days to expiration using a Livevol chart.
REPLAY: Round Table with Bill Ghauri
Round Table with Bill Ghauri. Bill presented his Long and Short trading systems using his automated back testing solution. Bill reviewed the importance of risk and money management in trading and sizing your trades correctly. Bill showed his backtesting tool in action and how his long and short systems use the 200 day moving average to guide trade entry. Bill also showed why selling iron condors is almost always a bad idea. Several attendees commented on how much they liked the presentation.
Enjoy the replay!
Weirdor Trade Alerts Already Paid For a 6-Month Subscription
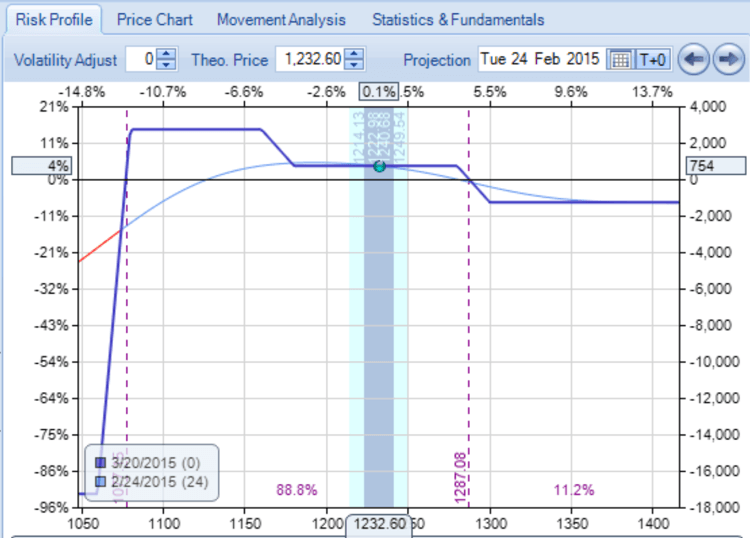
Amy Meissner launched her Weirdor trade alert service in Feb 2015 with a Weirdor trade usingi $18,661 of margin. The trade was open for 20 days and made a $701,(+3.76%) profit. The would have paid for a six month subscription with just one trade. If you had a larger account and traded a double sized position (two tranches), you would have made a $1402 profit, which would have covered the price of an annual subscription with $402 left over!
Amy has been trading Iron Condors and their variations for many years. She was written up in Technical Analysis of Stock and Commodities magazine for her Iron Condor trading. Amy's Weirdor is a variation of an asymmetric Iron Condor with her conservative risk and money management techniques added in.
Can the U.S. Dollar Crash the Stock Market?
Phoenix Capital Research published a very interesting article relating stock market movement to option expirations from the angle of looking at the Fed balance sheet.
Stocks roared higher last week because it was options expiration week (the Fed pumped $6+ billion to Wall Street to manipulate the markets higher). This is not conspiracy theory. Consider that technically ALL Fed QE programs ended in late October 2014. And yet, since that time, the Fed has made LARGE increases in its balance sheet (swapping liquidity for assets) on every single options expiration week with only one exception.
Weeks in which the Fed’s balance sheet shrunk are red. Weeks in which it expanded are black. And options expiration weeks are highlighted in gray. Note that the largest expansion moves per month occurred in options expiration weeks with the exception of February.

Today stocks are beyond overbought. There are little if any bullish developments to look forward to. After all:
1) The economy is weakening dramatically.
2) Both earnings and sales are rolling over.
3) The Fed FOMC meeting has ended and the Fed has reiterated that higher rates will hit at some point this year (when remains to be seen).
With that in mind, the S&P 500 looks to be putting in a double top. If we do not break through here (stocks would need to explode higher), we’re likely to see a correction down to 2000 or so.

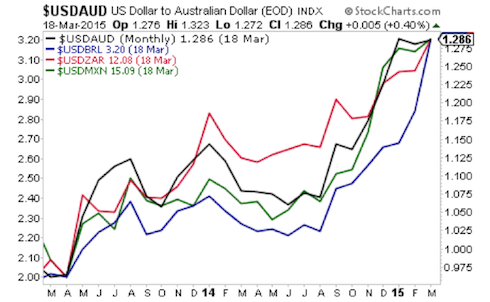
The truth of this recent move is that it largely coincides with the US dollar correction. The Dollar has rallied over 26% since July 2014. Trading algorithms adjusted to this new strength and now associate any US Dollar weakness as a sign to “buy stocks/ risk.”
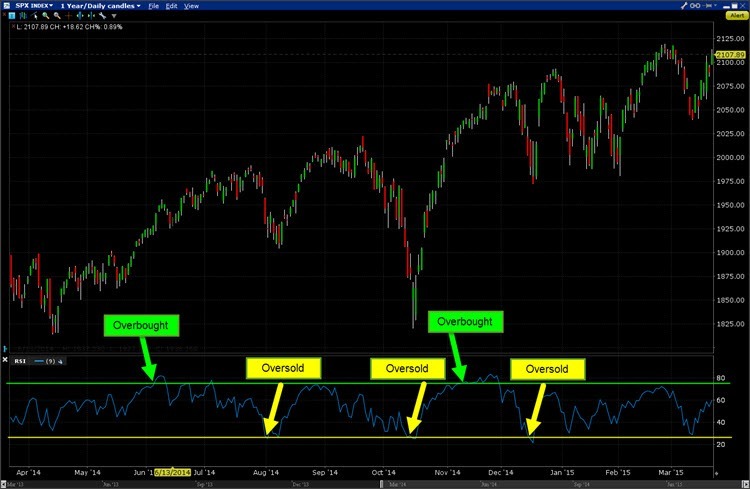
Does RSI Predict Market Direction the Following Week?
Dr. Terry Allen, from Terry's Tips, published a very interesting 100-week back test of the RSI to see if it predicts market direction for the following week.
Terry used the following RSI numbers for 2-day, 3-day and 5-day RSI readings:
Very overbought – an RSI reading of greater than or equal to 85.0
Overbought – greater than or equal to 75.0
Neutral – between 30.0 and 75.0
Oversold – less than or equal to 30.0
Very oversold – less than or equal to 20.0
Extremely oversold – less than or equal to 10.0
Here's how the last 100-weeks of readings on SPY were distributed:
Neutral – 47 weeks
Overbought – 16 weeks
Very Overbought – 22 weeks
Oversold – 5 weeks
Very Oversold – 8 weeks
Extremely Oversold – 2 weeks
Here are the numbers that show what happened to SPY in the week after the condition reported in each of Terry's Saturday Reports:
