Phoenix Capital Research published a very interesting article relating stock market movement to option expirations from the angle of looking at the Fed balance sheet.
Stocks roared higher last week because it was options expiration week (the Fed pumped $6+ billion to Wall Street to manipulate the markets higher). This is not conspiracy theory. Consider that technically ALL Fed QE programs ended in late October 2014. And yet, since that time, the Fed has made LARGE increases in its balance sheet (swapping liquidity for assets) on every single options expiration week with only one exception.
Weeks in which the Fed’s balance sheet shrunk are red. Weeks in which it expanded are black. And options expiration weeks are highlighted in gray. Note that the largest expansion moves per month occurred in options expiration weeks with the exception of February.

Today stocks are beyond overbought. There are little if any bullish developments to look forward to. After all:
1) The economy is weakening dramatically.
2) Both earnings and sales are rolling over.
3) The Fed FOMC meeting has ended and the Fed has reiterated that higher rates will hit at some point this year (when remains to be seen).
With that in mind, the S&P 500 looks to be putting in a double top. If we do not break through here (stocks would need to explode higher), we’re likely to see a correction down to 2000 or so.

The truth of this recent move is that it largely coincides with the US dollar correction. The Dollar has rallied over 26% since July 2014. Trading algorithms adjusted to this new strength and now associate any US Dollar weakness as a sign to “buy stocks/ risk.”

The fact of the matter is that whatever the markets do in the short-term is largely irrelevant. The REAL problem is the $9 trillion US Dollar carry trade.
Globally, the world is awash in borrowed money… most of it in US Dollars. The US Dollar carry trade is north of $9 trillion… literally than the economies of Germany and Japan COMBINED.
When you BORROW in US Dollars you are effectively SHORTING the US Dollar. So when the US Dollar rallies… you have to cover your SHORT or you blow up.
This is what resulted in the complete carnage in Emerging Market currencies earlier this year. And it’s not over by a long stretch.
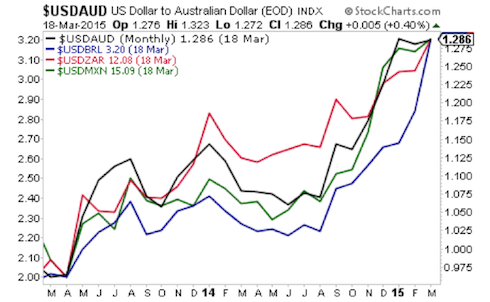
Here are the monthly charts for the USD/ Aussie (black line), USD/ Brazilian Real (blue line), USD/South African Rand (red line), and USD/ Mexican Peso (green line) pairs. The carnage over the last nine months has been extreme with double digit moves across the board.
The US Dollar took down Oil, commodities, even emerging market currencies. Stocks will be next. The first REAL sign that the 2008 Crash was coming occurred when the US Dollar began to skyrocket in the summer of 2008.
So while stocks might spike as the US Dollar rally takes a breather, the reality is that we’re in for a REAL crisis later this year.
The time to prepare is now, BEFORE it hits.
If you’ve yet to take action to prepare for the second round of the financial crisis, we offer a FREE investment report Financial Crisis “Round Two” Survival Guide that outlines easy, simple to follow strategies you can use to not only protect your portfolio from a market downturn, but actually produce profits.
Phoenix Capital Research