BLOG
OptionVue Education with James Hogan
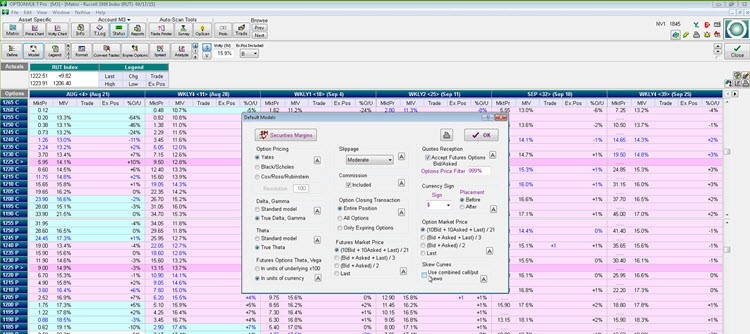
OptionVue Education with James Hogan from OptionVue Systems International. James covered basics of setting up an account, default models and settings and many useful tips and tricks of using OptionVue software. James discussed a few new features with earnings that are being released soon.
Enjoy the replay!
Round Table Replay with Amy Meissner – Pitfalls of Complacency
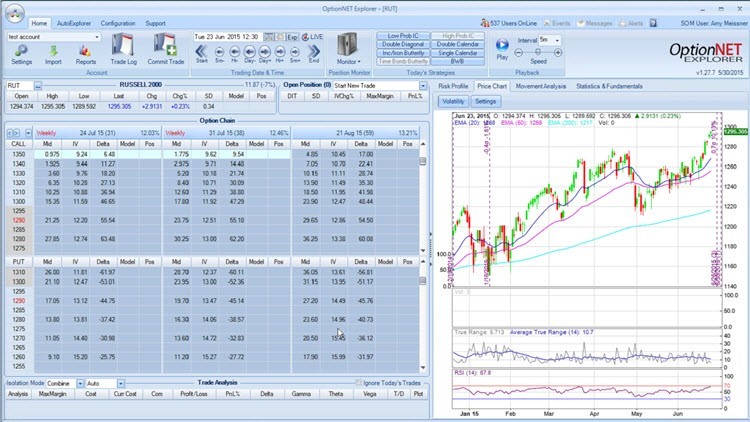
Veteran trader Amy Meissner presented “Pitfalls of Complacency”. Amy covered several good lessons we should all remember while we're trading. We talked about black swan events and some things to do to protect your trading account from blowing up.
Enjoy the replay!
Weighted Vega Round Table Replay with Ron Bertino
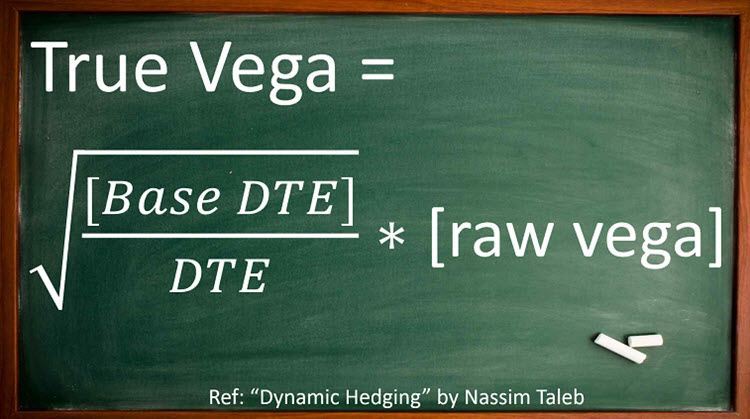
Veteran trader Ron Bertino presented “Weighted Vega” and it was a stunner. Ron presented several option trading concepts that are commonly believed by option traders and dispelled most of them. Which of these statements do you think are true and which are false?
- A longer term calendar will give me more long vega exposure.
- I'm bearish so I'm going to load up on vega by buying a calendar using LEAPS.
- Someone using an upside OTM call calendar is crazy…don't they know it's positive vega?
- IV almost always goes up 2 to 3 weeks or so prior to earnings, so I'm just going to trade calendars before earnings and get rich.
- Initiate calendars when IV is low
- You'd be crazy to trade an iron condor which is really way out in time.
This presentation was so powerful, Bill Ghauri immediately implemented Weighted Vega into his TOS tools (available to his Alpha alert subscribers only) and Karen Rae from OptionVue is forwarding this to Len Yates to consider implementing into OptionVue software!
REPLAY: Round Table with Mark Alpers
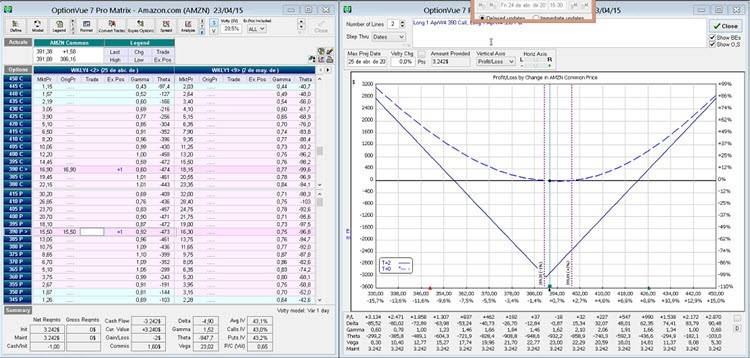
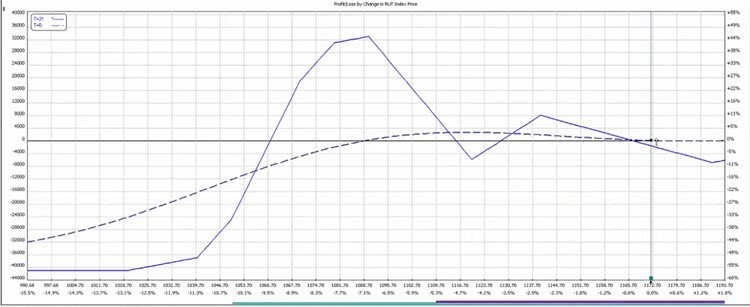
Veteran trader Mark Alpers presented his Weirdor guidelines and walked through his live trades and answered questions about his Weirdor trade.
Enjoy the replay!
Exposure Fee at Interactive Brokers
I had a few short SPX puts on the other day and I received an email telling me about the exposure fee at Interactive Brokers. The email was titled:
Charges to Accounts with Very High Worst-Case Loss Exposure
The fee doesn't start until July 17th and my four naked puts would have had a daily fee of $1.13, which isn't a lot if you consider I sold them for an average of $2,100 each. The options expired in just over 70 days so the total fee would be around $79, assuming the fee was the same each day.
Is Your Trade As Safe As You Think It Is?
One measure of risk that is common for option traders is to use standard deviations of movement. I built a popular Standard deviation calculator to calculate the range of movement for a given set of numbers. It was accessed nearly 500 times in the past week! An option...
Announcement: New Gold Membership
We are pleased to announce the roll out of our new Gold Membership at Capital Discussions. The new Gold Membership will be in effect on Friday, June 26, 2015 at 4:30pm Eastern Time.
We will always have the core part of our community be free. The Gold Membership adds enhancements to the core features. We are using a participation model. There are two ways to get a Gold Membership:
- Participate in the Capital Discussions community as
- A trading group leader or trading group assistant leader
- A Round Table speaker in the last six months
- A subscriber to any of our experts
- An active one-on-one mentoring student
- Pay a small fee to contribute financially to keep the web site running.
($12.50 per month or $125.00 per year)
REPLAY: Round Table with Ricardo Saenz de Heredia

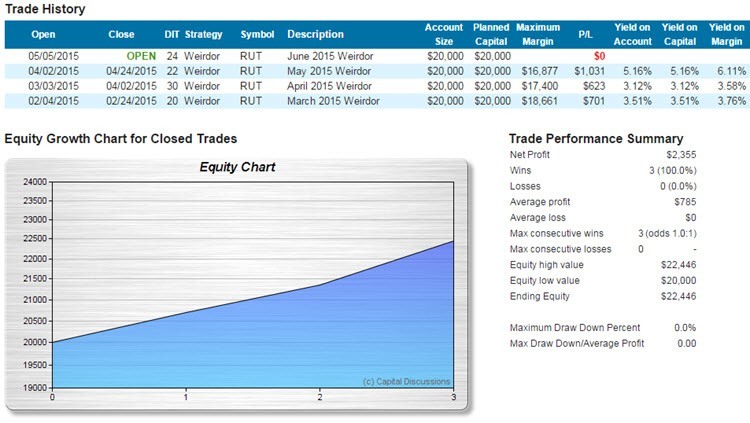
Amy Meissner updated her Weirdor trade results and showed how she changes her window to trigger adjustments. Amy answered questions about the Weirdor trade and showed how it's low draw downs have a superior equity growth chart.Amy reviewed her Weirdor trade performance, how her window expands for adjusting over time and answered questions.
Learn more about Amy's Weirdor alert service.
Enjoy the replay!
REPLAY: Round Table with John Locke

Amy Meissner updated her Weirdor trade results and showed how she changes her window to trigger adjustments. Amy answered questions about the Weirdor trade and showed how it's low draw downs have a superior equity growth chart.Amy reviewed her Weirdor trade performance, how her window expands for adjusting over time and answered questions.
Learn more about Amy's Weirdor alert service.
Enjoy the replay!
REPLAY: Round Table with Amy Meissner

Amy Meissner updated her Weirdor trade results and showed how she changes her window to trigger adjustments. Amy answered questions about the Weirdor trade and showed how it's low draw downs have a superior equity growth chart.Amy reviewed her Weirdor trade performance, how her window expands for adjusting over time and answered questions.
Learn more about Amy's Weirdor alert service.
Enjoy the replay!

