One measure of risk that is common for option traders is to use standard deviations of movement. I built a popular Standard deviation calculator to calculate the range of movement for a given set of numbers. It was accessed nearly 500 times in the past week!
An option trader can also use Delta to estimate the probability that an option will expire in the money. If you sell an iron condor, you would add up the absolute values of the deltas to give you the rough approximation of the probability of the entire trade expiring in the money.
RUT Iron Condor Example
Many of the Capital Discussions members trade the RUT as the underlying. Let's put a hypothetical trade on:
| Symbol | Expiry | Action | Quantity | Strike | Type | Price | Delta |
|---|---|---|---|---|---|---|---|
| RUT | JUL5 | BUY | +10 | 1310 | CALLS | 2.28 | +9.46 |
| RUT | JUL5 | SELL | -10 | 1290 | CALLS | 6.20 | +21.4 |
| RUT | JUL5 | SELL | -10 | 1200 | PUTS | 11.15 | -20.5 |
| RUT | JUL5 | BUY | +10 | 1180 | PUTS | 7.85 | -14.5 |
Here is a summary of the position:
| Delta | Gamma | Theta | Vega | DTE | SV | ATM Call IV |
|---|---|---|---|---|---|---|
| -59.16 | -3.72 | 193.3 | -576.3 | 25 | 11.7% | 18.7% |
This is what it looks like in OptionVue software:
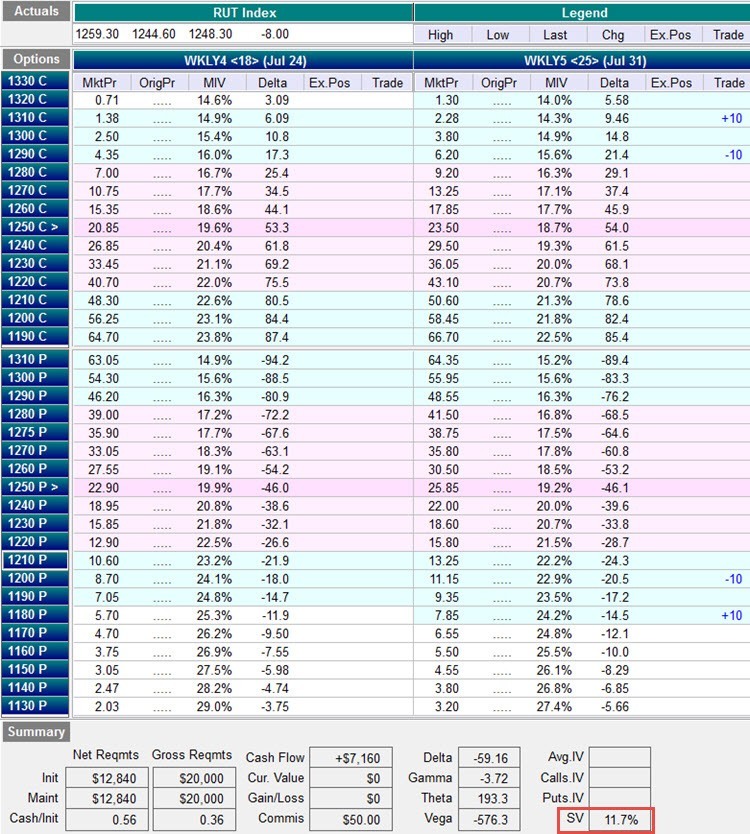
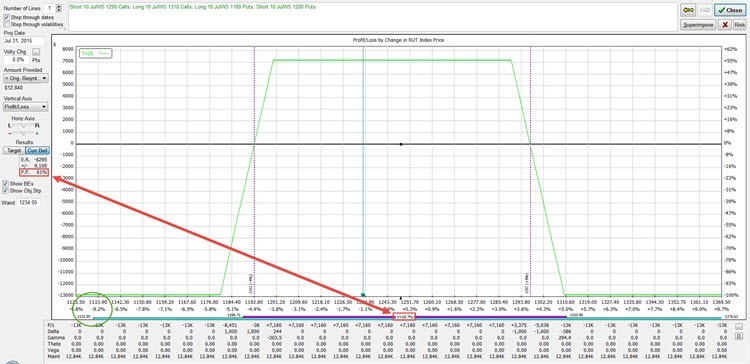
If you look at the full size image, you'll see on the left that OptionVue is estimating an 83% probability of profit at expiration. Pretty good right?
Should we use Statistical Volatility (SV)?
Statistical Volatility (SV) is backwards looking and shows you what the underlying actually did. Implied Volatility (IV) is normally what traders use to look forward to estimate their probabilities. A common IV is the Call at-the-money IV for the expiration you are trading in. In this case, that's a volatility of 18.7%, which is 7.0% higher than SV in our example. The market is anticipating higher volatility.
What happened to our probabilities?
Notice the two standard deviation range expanded quite a bit. The price went from 1174.22 to 1131.95, or a 42.27 point further drop! Our probability of profit went from 83% to 61%. Ouch. Not quite as safe as we thought it was.
What changes if the market sells off?
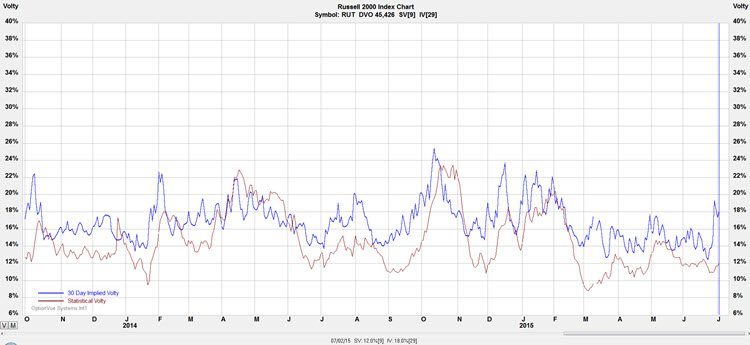
Volatility will increase. Let's look at the volatility chart to see how much it might go up:
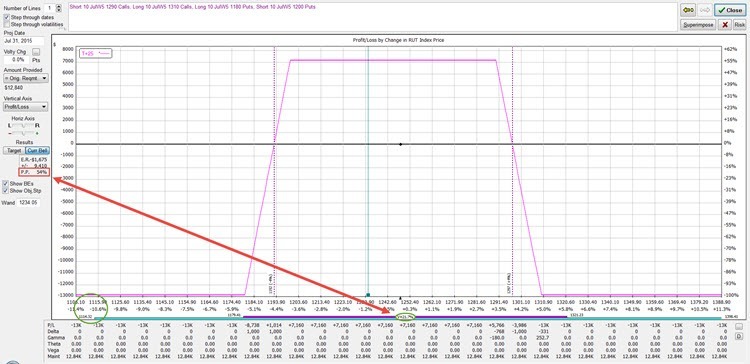
It is reasonable to assume volatility could rise an addition 3% if the market sells off. Let's bump the volatility up to 21.7% and see how things look:
Things got even worse! Our probability of profit isn't 83% but is now at 54%. Our two standard deviation move lower boundary is at 1114.32, or 59.90 points lower that we initially thought it was.
What does this mean?
When you are evaluating a trade during lower volatility, you can often find very comforting percentages, but if volatility rises, the numbers get worse very quickly. Be prepared for fast moving markets and plan on volatility rising. Don't assume the probability of profit will remain the same or improve as time passes. If you get a quick market move and volatility spikes, your beautiful risk chart can transform into an ugly chart very quickly.
Don't get lulled into a false sense of security. Plan on volatility rising and the standard deviation ranges expanding as volatility rises.




Great post — thanks Tom
Thanks Bob. You can get lulled into a sense of security when volatility is low but a quick move to the downside will open your eyes!
Nice Post Tom.
How do you change the volatility in OV to see the standard deviation changes?
thanks
Hi Damien,
If you have a matrix open, there should be an input text box with a label of “Volty (SV) above it. That’s the volatility OV is using to calculate the standard deviations in the matrix and analyze chart.