How the VVIX can be Used as a Barometer in Trading
Most traders are familiar with the VIX, which measures the volatility of the S & P 500. The VIX was introduced in 1993 by the Chicago Board of Options Exchange. The index measures the 30-day forward volatility of a combination of put and call options on SPX. The VIX is also sometimes referred to as the “fear index” by investors.
Today we will talk about another instrument that measures volatility, the VVIX. The VVIX is a measure of the expected volatility of the 30-day forward price of the VIX. Basically, the VIX gives an indication as to whether SPX option prices are rising or falling. The VVIX is often referred to as “the VIX of the VIX”.
How is the VVIX calculated?
The VVIX reflects the prices of a range of both at-the-money and out-of-the-money VIX options. The actual calculation entails three steps:
1) Locate expected variances relative to different option expiration cycles for the VIX.
2) Incorporate a variance for 30 days forward.
3) The last step is taking the square root of that number (calculated in steps #1 and #2) and multiply by 100 to express the VVIX as a percent.
The prices for VVIX are updated every 15 seconds, and its term structure set at each day's close. The VVIX term structure is plotted on specific expiration cycles. For example, June 2019 measures the expected volatility of prices in the June 2019 VIX futures.
Below is a one year, daily chart of the VVIX from Think or Swim. For comparison purposes, the VVIX chart (black line) is compared with the VIX for the same period (red and green line).
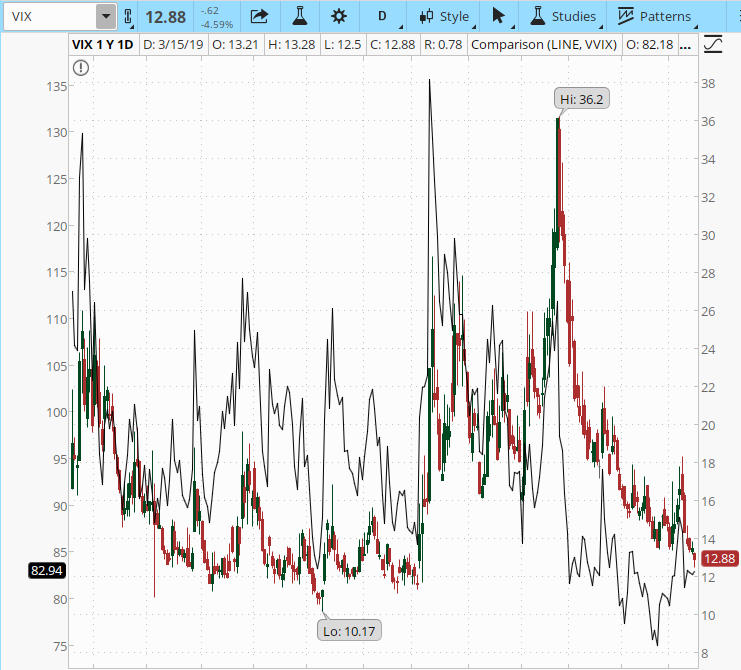
Figure A. One year VVIX chart (black line) compared with VIX (red and green line)
As you can see from Figure A, there is some correlation of price action between the VVIX and VIX. This correlation is closest at extreme values. According to the Cboe (Chicago Board of Options Exchange), historically the long term mean price of the VVIX is 86.
Below is a six month chart of the VVIX, which shows the index currently at 82.94, slightly below the long term mean.
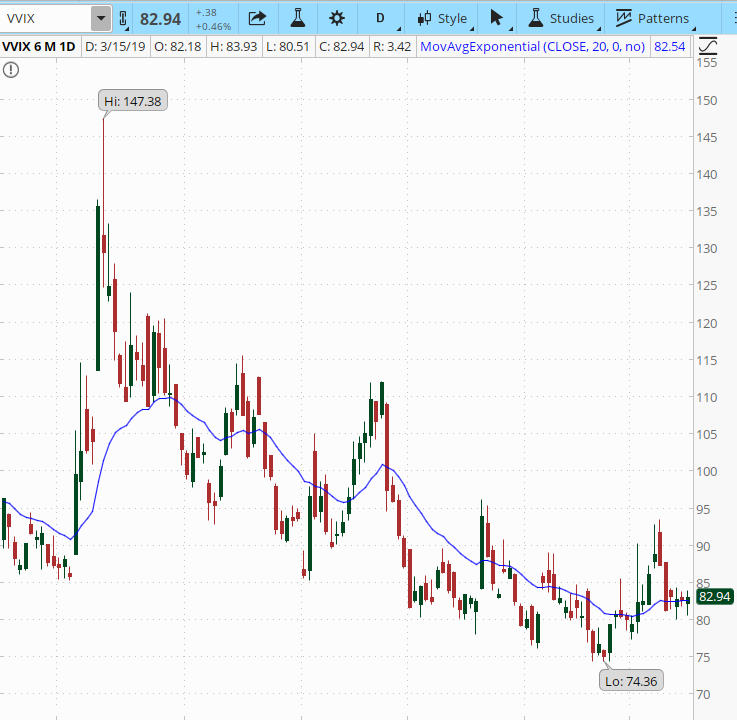
Figure B. Six month chart of VVIX showing the current price of VVIX at 82.94
The long term mean price of the VIX is 24. Below is a six month chart of VIX, which indicates the current value (12.88) is below the mean.
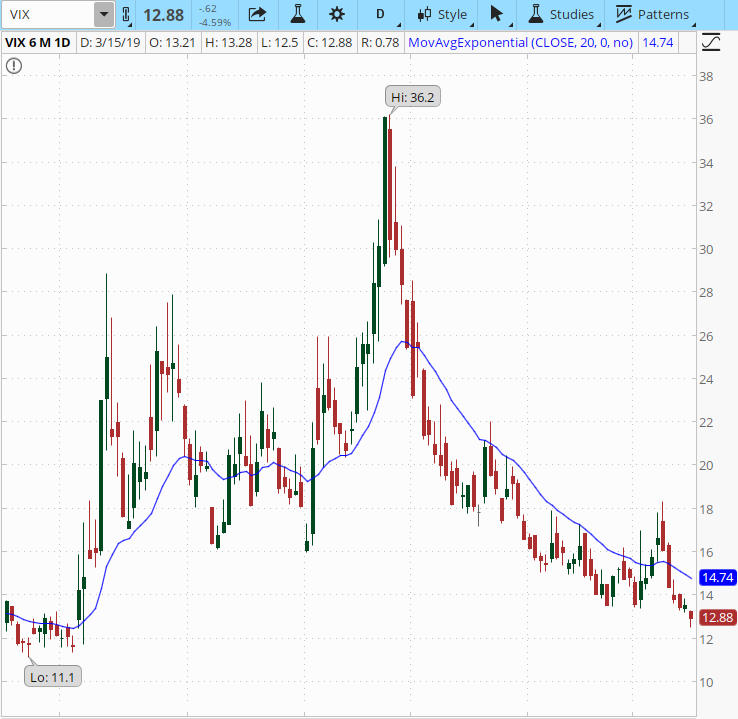
Figure C. Six month chart of VIX
The VVIX is considered high by many traders when it is over 100 to 110. When the VVIX is at its mean (86) or lower, it is an indication that overall market volatility is low.
What are the similarities and differences between the VIX and VVIX?
- Both the VVIX and VIX measure implied volatility of options 30 days to expiration. The VIX measures the implied volatility of the S & P 500 Index; the VVIX measures the implied volatility of the VIX.
- The calculation for the two indexes is the same; except the VVIX is calculated using VIX option prices, and the VIX is calculated using SPX options.
- Option premium prices will be relative for both: When VIX is higher, SPX options prices will be higher, all else remaining the same. This same logic applies to VVIX. When VIX option premiums are higher, VVIX will be higher, again all else remaining the same.
How can traders capitalize on high and low levels of the
VVIX?
Traders can benefit from observing the levels of the “VIX of the VIX” because it provides useful insight into VIX futures and options prices. These observations can bring to light:
- The expected volatility of the VIX.
- The expected volatilities that influence the inclination of options prices on the VIX for varying expiration cycles.
- VVIX can give a general idea of market confidence in the future values of the VIX.
Many traders who observe the levels of the VVIX, along with the VIX, choose to place option trades on the VIX itself. A few choices based on various levels may include:
- If both VIX and VVIX are trading near the high end of their historical ranges, well above the mean, a trader may consider entering a call credit spread on the VIX, because the potential for both VIX and VVIX to revert back toward their historical mean is relatively high.
- If both VIX and VVIX are trading at the lower end of their historical ranges, a trader may want to consider purchasing a long call or a call debit spread in the VIX, and that strategy would perform well if and when the VIX and VVIX rises.
- If both VIX and VVIX are at the mid-point of their historical means and a trader believes there is not a substantial move apparent in either direction, he/she may consider placing an Iron Condor trade on the VIX. If the VIX continues to remain stable without a big move, this type of position would benefit.
In summary, regardless of what particular trade strategy you have in your portfolio, the VVIX is a very useful tool that many traders stay abreast of. Even if you choose not the trade VIX options based on the levels of the VVIX in correlation with with levels of the VIX, price action of the VVIX may serve as an additional alert in your trade plan to call attention to changes in the volatility environment. This may indicate it is time to adjust or exit an existing positon, or present an opportunity to enter a new position based on your market bias.
If you have found monitoring the VVIX helpful in any particular way and would like to share, feel free to comment below.
Are you looking for a mentoring program, trading group, or a group of like-minded traders to share both positive and negative trade experiences?
Look no more, join today!

