Are you using oscillators such as fast and slow Stochastics, Williams % R, and MACD? Have your results been less than you had hoped? Then you may want to take a look at the Choppiness Index.
The Choppiness Index can be used as an indicator which could give hints as to the extent of a trend, and when a trend may be getting ready to end. The choppiness index can also show indications of consolidation in the instrument you are analyzing. This could lead to better entries and exits in your trading.
The Choppiness Index
The choppiness index was inspired by E.W. Dreiss. He based the index on “chaos theory and fractal geometry”.
This indicator shows the rhythms of today's current markets. As a trader, it is very important to read and monitor the strength of the underlying price action to determine when a trading opportunity exists.
The Choppiness Index (CI) ranges between zero and one hundred. The higher the number, the choppier the underlying price action tends to be. The lower the number, the more trending the price action tends to be.
Very low readings in the CI tend to correspond closely with a possible end of strong impulsive movements which can be either up or down. High readings in the CI occur after there has been a significant consolidation in the price action.
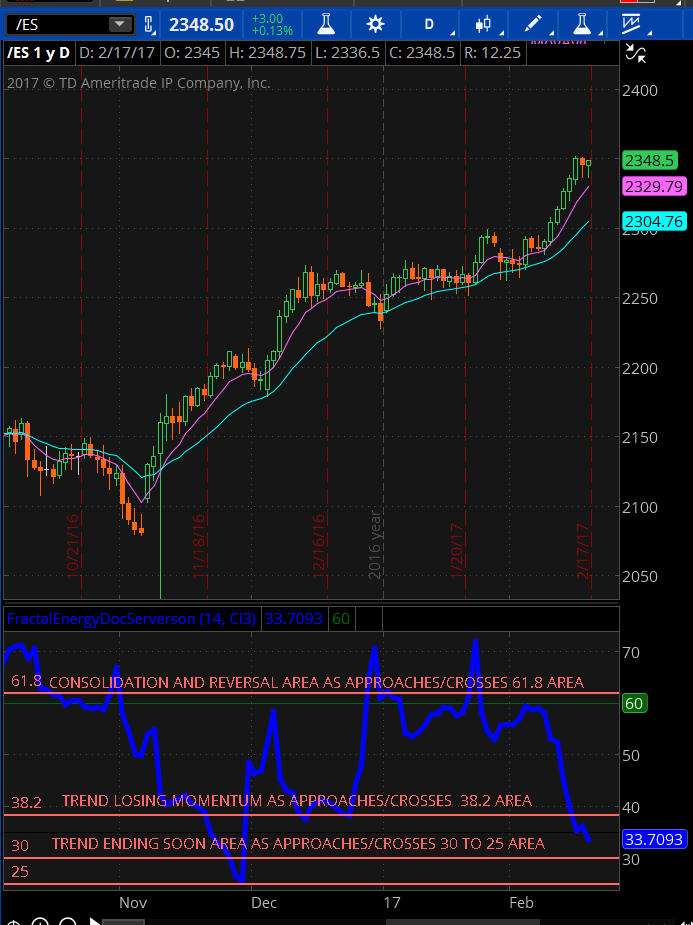
Figure A: SPX Daily Chart with Choppiness Index Indicator
What do markets tend to do?
Markets tend to trend for awhile, then they will rest. This rest can occur by consolidation, which could result in a sideways trend. The trend many times will reverse in the opposite direction. Then the market will often resume back in the original direction of the trend. Other times, the market will reverse from the original trend direction and trend in the opposite direction.
Recharging or Coiling in the Market.
When a trend is created, it takes a lot of participation from investors. The trend will last as long as there are investors participating in the trend. The trend will not last forever.
When the trend comes to an end, fewer investors are participating in the trend. When the end of a trend occurs, many times this will allow the trend to pause a bit, coil up, and recharge. The recharge can happen in numerous ways. For instance, the trend can recharge by consolidating and moving sideways for period of time. Or, the trend can pull back taking a medium amount of time. Other times, the market can pull back sharply which can take a short period of time.
Another way the market can recharge is by a slow and steady grind to the upside. In this case, if the market is in a bullish trend, it will recharge itself by making very small gains. These small gains allow the market to recharge. Many times these small gains lead to a trend which lasts a long time.
Some Methods to Use the Choppiness Indicator.
The Choppiness Index is usually set up with a period of 14.
Many use a number at or above 61.8 to signal a consolidation area. This consolidation could be a time the market is recharging. A level less than 38.2 could be an indication the market has been trending, and the odds are the market will tend to move back into or towards consolidation. The level below 30 to 25 could be an indication of the trend coming to an end very soon.
If you are in a directional trade and the Choppiness Index has moved below the 38.2 level then reverses and moves above the 38.2 level, it might be a time when profits could be taken. The end of the trend may be near. This could be an indication the trend is reaching maturity and may reverse or head towards a sideways range or choppiness in the price action.
When the CI level reaches areas close to or above the 61.8 level , many times price action has entered into a choppy or sideways range. When price action moves below the 61.8 level, it may signal price action will move into a trending scenario.
A good video to watch explaining the Choppiness Index indicator can be found at Doc Severson Choppiness Index.
In Summary
Not all trading platforms have the choppiness index. If your platform does not offer it, may I suggest doing a Google search. There are a number of resources available which will allow you to obtain the choppiness indicator.
Using the Choppiness Index as an indicator along with price action, and using both consistently, is essential. As you become familiar with the choppiness index along with price action, you will learn how the two react in tandem with the market. Remember, the Choppiness Index does not show the direction of the market, it only gives clues on the change of a trend.
References for this article can be found at Association of Technical Market Analysts (Page 16)
If you are looking for a trading community that has a wide variety of programs including one-on-one mentoring, educational classes, and interactive trading groups, consider joining Capital Discussions. You will not be disappointed in the programs offered.