
Today we will talk about another technical indicator, the Relative Strength Index (RSI). The RSI is considered to be a leading indicator similar to Stochastics and Williams %R, and generally, precedes price movement in the underlying. RSI is a popular indicator used by many traders to identify potential buy and sell signals, confirming trends, and indicative of possible trend reversals. As with any technical indicator, it is best used in conjunction with price action, on a consistent basis.
The Relative Strength Index was developed by J. Welles Wilder, who also developed the popular Average True Range indicator. The RSI is a momentum oscillator. Momentum oscillators measure the speed and change of price movements.
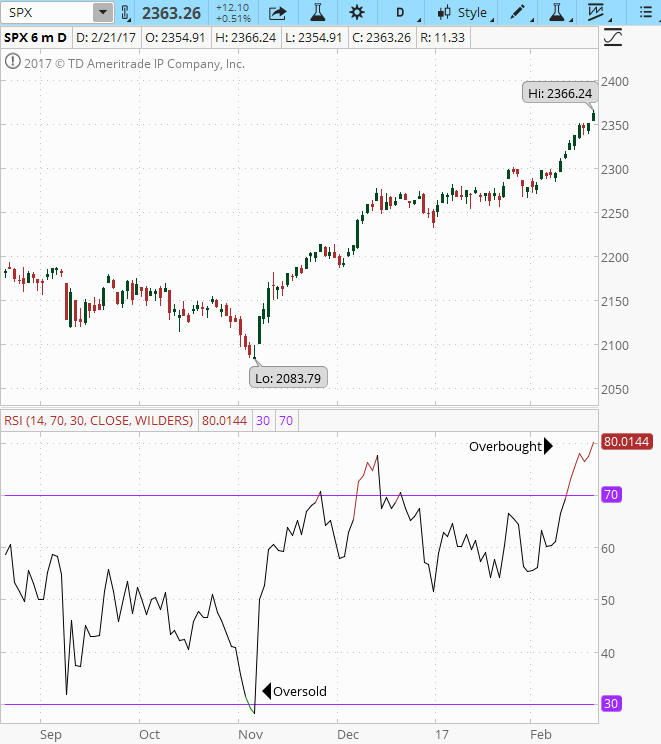
The RSI is an indicator that oscillates between zero and 100. Traditionally, the RSI is considered overbought when above 70 and oversold when below 30.
Below is a six-month chart from Think or Swim showing their default settings on the Relative Strength Index.
 h daily chart from Think or Swim
How does the Relative Strength Index Work?
The RSI indicator is most often used on daily charts with a period of 14, which equates to 14 days as in Figure A above. Decreasing the number of periods makes the indicator more sensitive to price changes. Increasing the number of periods makes the indicator less sensitive.
The RSI moves higher when the average gains over a period are larger than the average losses. The indicator moves down when the average losses are greater than average gains. Said another way, if the indicator is at 100, over the last 14 periods it's indicating the previous 14 periods were gains. If the indicator is at zero, the last 14 periods were losses.
Using the indicator on other timeframes also works; it is a trader's choice. For example, a 14-period RSI applied to an hourly chart will base calculations off the last 14 hours.
How is the Relative Strength Index used by traders?
The three most popular ways that traders use the RSI are overbought/oversold levels, price ranges/trends, and divergence.
- Overbought/Oversold
When the RSI is above 70, it is considered to be overbought in that the underlying is in a strong uptrend which may be indicative of a future reversal. When the indicator is below 30, it is at an oversold level indicating a downtrend, and the price may be due for a rebound. Traders often wait for a confirmation in the change of direction, for example allowing the price to cross below 30 and then rally back before going long. Or, let the price cross above 70 and then drop below it before going short. - Trends
If the underlying is trending, the RSI will usually stay contained within certain readings. As an uptrend starts, it typically approaches or bottoms around 30 and frequently reaches 80+ at the trend's maturity. During a downtrend, the indicator will typically top out before 70 during the trend. Every underlying move differently, therefore will have different ranges that traders will use to identify trends and possible trend reversals. - Divergence
The RSI is also sometimes used to spot divergence. A bearish divergence is when the price is rising, but the RSI falling. It can be a signal that the price could soon correct lower, since buying momentum is slowing.Bullish divergence is when the price is falling, but the RSI is rising. It can be a sign that the price could soon move higher, since selling momentum is slowing.
Divergence (bullish or bearish) is not an entry or exit timing signal, as it can sometimes continue for a long time. Rather, divergence does help confirm other signals, and can let traders know when a trend may almost be over.
In summary
The RSI is a popular indicator because it has multiple uses. It can be used to find entry and exit signals based on overbought/oversold reading and trending ranges and can help spot or confirm reversals via divergence. However, like any technical analysis tool, the RSI is prone to providing false signals at times. Price analysis is still needed to determine if a trend is present, and then the key RSI levels identified for that particular security.
Feel free to comment below if you have any tips to share on how the use of RSI has helped your trading.
Have you joined Capital Discussions?
Do yourself a favor it is free to join…
Go to … Join Capital Discussions.