
The Stochastic Oscillator was developed by George C. Lane in the 1950's. It is a momentum indicator that shows the location of the underlying's close relative to its range of the highs/lows over a set number of periods. This indicator follows the speed or the momentum of the price of the underlying.
The Stochastic Oscillator will be discussed in a two-part series; Part I will outline the basics of this popular indicator and the three versions available to traders.
The Stochastic Oscillator is used by many traders to identify bullish and bearish trade setups, as it is helpful to identify potential reversals in the underlying. It also can be useful for identifying overbought and oversold levels. The Oscillator is based on the observation that as prices go up, closing prices tend to be closer to the upper end of the price range. Conversely, as prices go down, the closing price tends to be near the lower end of the price range.
The Stochastic Oscillator consists of two lines which oscillate within the range of 0 to 100. The %K is the main line. The %K line shows the ratio of the differences between the current closing price AND between the highest and lowest prices. The second line is the %D line, which is a moving average of %K over a chosen period. The %D line is considered to be the signal line. Many traders use the %D crossing through the %K as a reversal indication, signaling a buy or sell which can aid in trade entry and exit.
With today's charting packages and technology, it is not necessary to know the formula of how the Stochastics Oscillator is calculated. For information purposes, however, this formula is shown below:
%K = (Current Close – Lowest Low)/(Highest High – Lowest Low) *100
%D = 3-day Simple Moving Average of %K
There are three versions of the Stochastic Oscillator: Fast, Slow, and Full.
Below is a six month chart of SPX as shown on the Think or Swim platform, with TOS' default settings showing Fast, Slow, and Full Stochastics. Most settings can be changed as traders choose to do so, in order to suit their personal trading style. The chart includes all three versions of the Stochastic Oscillator. The studies include:
- Overbought and oversold conditions (green line)
- %K line (red line)
- %D line (blue line)
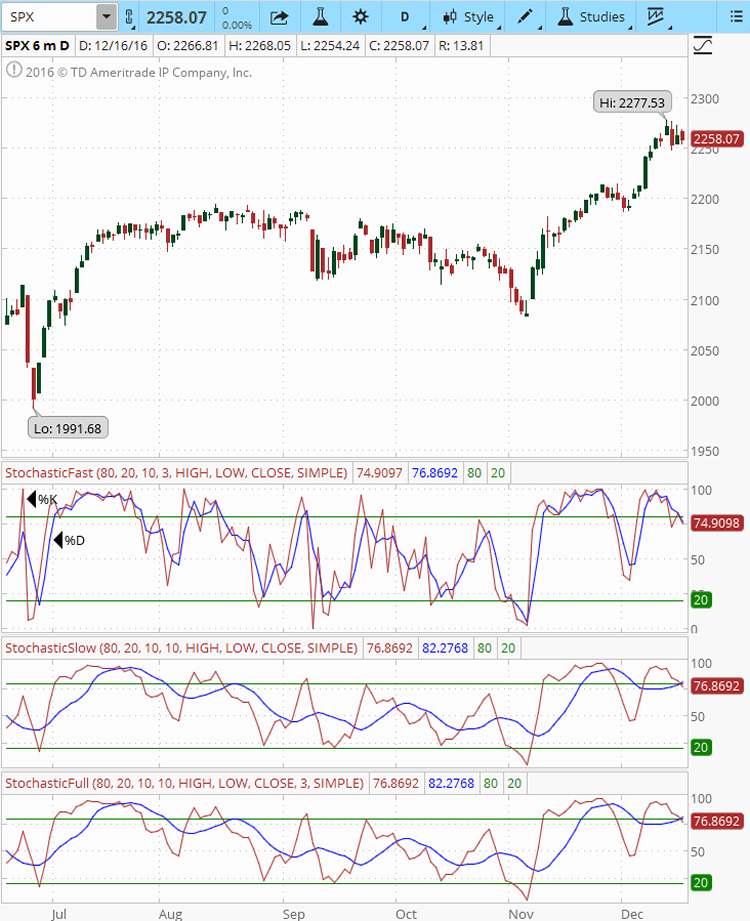
Figure A. SPX Chart withFast, Slow, and Full Stochastic Oscillators
Part II of this discussion on the Stochastic Oscillator will outline the differences between these three versions of the Stochastic Oscillator, and some tips on which version may help you with your technical analysis.
Are you looking for a mentoring program, trading group, or a group of like-minded traders to share both positive and negative trade experiences? Look no more, go to: Capital Discussions.
You will find a wide variety of educational services in addition to the trading groups that meet on a regular basis to exchange their trades and ideas.