Bollinger Bands are a technical indicator created by renowned technical trader John Bollinger in the early 1980's. There are numerous publications, as well as John's website www.bollingerbands.com, that go into great detail on this popular tool used by many traders. This article will touch on the basic parameters of Bollinger Bands and how they may be used in options trading.
Bollinger Bands are considered to be a volatility indicator, similar to the Keltner channel indicator. Their purpose is to provide traders a relative definition of highs and lows. This means that prices are high at the upper band, and low at the lower band. Bollinger Bands can help recognize price patterns, and can be useful to traders of all levels in their trade entry, management and exit strategies.
Below is a screenshot of a chart of the SPX with Bollinger Bands set at their default settings:
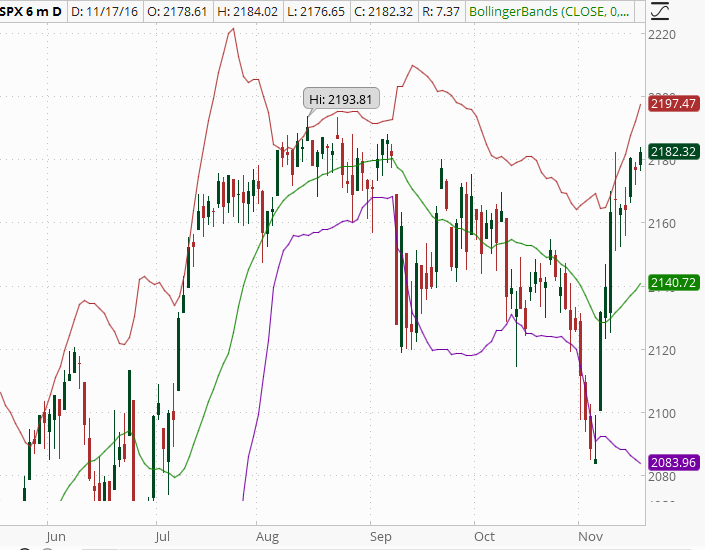
SPX 6 Month Chart from Think or Swim with Bollinger Bands
The Bollinger Bands study as shown on Thinkorswim consists of two lines plotted, two standard deviations above and below a moving average. The standard deviations can be changed based on a trader's choice, as can the other settings will are explained below. The standard deviation lines change as price and volatility goes up or down.
The upper band can indicate an overbought level, while the lower band can indicate an oversold level. However, as we have all seen at times, if prices approaches either band, or bounces off, it is not a guarantee of a breakout or reversal.
The default settings in the above Think or Swim chart are shown below:
![]()
Thinkorswim's Default Bollinger Band Settings
- CloseThis represents the price which is used to calculate the moving average and the standard deviation. Depending on which charting software is being used, traders can choose other parameters such as open, volume, etc.
- 0 This is the “displace” setting; the number of bars to shift the study forward or backward. TOS' default setting of zero is preferred by many traders.
- 20This is the “length” setting; the number of bars used to calculate the moving average and standard deviation. In this case 20 is the 20-day simple moving average.
- -2.0, 2.0These two settings are the number of standard deviations up and down to plot the lower bars
- SimpleThis is the moving average; this can also be changed to Exponential, etc., based on a trader's preference. On the chart, the moving average is the middle line, and the upper/lower lines represent the standard deviations up and down as selected.
How do traders use Bollinger Bands?
The way traders interpret and use Bollinger Bands varies, depending on the individual and trading style. Some choose to buy when price touches the lower Bollinger Band, and close the position when the price rebounds to touch the moving average (center line). Others may choose to go long when price breaks out above the upper Bollinger Band, or go short if the price falls below the lower band. It is also worth noting that the use of Bollinger Bands is not limited to stock traders. Because the Bollinger Bands indicator is a volatility study, some options traders sell options when the bands are spread apart, or buy options when the bands are close together. In both of these cases, the trader is expecting volatility to retrace to the average historical volatility level for that particular underlying.
When the Bollinger Bands are close together, it usually indicates a period of low volatility. On the other side of the coin, as the bands expand and move farther apart, an increase in volatility is indicated. Lastly, when the bands only have a slight slope and track fairly even for a period of time, it indicates that the price of the underlying may continue to channel in between the bands.
Many traders also like to use Bollinger Bands in conjunction with other indicators to confirm price action, such as a trendline. If the trendline confirms the movement suggested by the Bollinger Bands, the trader may have more confidence that the bands are predicting a correction in the price action in relation to market volatility.
I hope this “Bollinger Bands in a Nutshell” has given some of you an insight on this popular technical indicator. Like all the technical indicators, they are not “guaranteeing” price action, but can be used as a guide for traders in their entry, management, and trade exits. Subsequent articles will cover more technical indicators widely used by traders of all levels.
Become a part of Capital Discussions. It is free and informative…https://CaptialDiscussions.com