The origin of moving averages can be traced back to 18th Century Japan, and are now used by the majority of traders in some form or another. Those who have studied the early use of moving averages have the understanding that simple moving averages (SMA) were used long before exponential moving averages (EMA). The reason is believed to be because EMAs are built upon the SMA framework, and the SMA was more easily understood during the early use of moving averages. This week I will cover the basic differences between these two types of moving averages.
Simple Moving Average (SMA)
A simple moving average is built by calculating the average of a certain period of time. For instance it could be minutes, days, weeks, months, or years.
Some traders prefer to use simple moving averages for tracking market price action because they are easy to understand and calculate. In the early days of trading before the sophisticated technology available today, traders had to rely primarily on market price action as their only means of technical analysis. Many had to calculate market prices manually, and plotted those prices to determine a trend.
To calculate a simple moving average, let's use a 20-day moving average as an example. Simply add the closing prices of the last 20 days, and divide by 20.
While this formula is a simple one, it is worth noting that the SMA formula is not only based on daily closing prices, but it is a mean of prices – a “subset”. It is called a “moving average” because the group of closing prices used in the calculation relate to the points on the chart. This means the older days are dropped from the calculation of the SMA in favor of new closing price days. Therefore, a new calculation is always needed to correspond to the time frame of the average being used. So, in the 20-day example, this is recalculated by adding the new day and dropping the previous 20th day.
Exponential Moving Average (EMA)
The exponential moving average has been increasing in popularity by many traders over recent years. The EMA focuses on the most recent prices, rather than a long series of data points. With technology available today, the EMA is calculated automatically on most charting services. The EMA gives weight to more recent prices, and it gives more emphasis on closing prices which are closer to the present time. For those interested, however, below is the formula for calculating the EMA, according to Investopedia.com.

Formula to Calculate EMA Courtesy of Investopedia.com
What is the difference between the SMA and EMA?
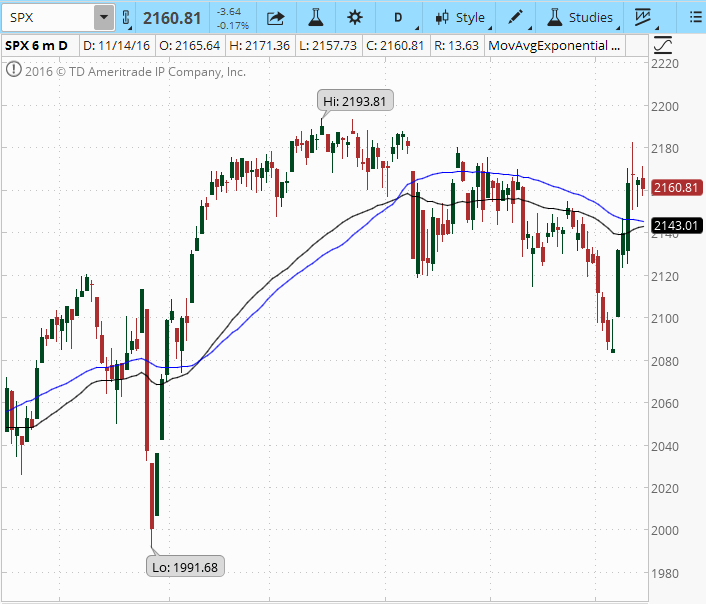
To illustrate the differences between these two moving averages, both are plotted on the SPX chart below:

SPX 6 Month Chart with EMA and SMA
The above chart indicates the 50-day EMA (black) and SMA (blue). Note that the EMA responds more quickly to changing prices than the SMA. You will notice how the EMA has a higher value than the SMA when prices are rising, and also falls more quickly than the SMA when prices are declining. This responsiveness of the EMA is one reason many traders prefer to use the EMA over the SMA.
What do the different number of days mean in these moving averages?
Whichever moving average you may choose to use, both can be customized to a trader's preference. Some of the most common time periods used in moving averages are 15, 20, 30, 50, 100, and 200 days. The shorter the time span used, the more sensitive the average will be to changes in the price of the underlying. The longer the time frame, the less sensitive the moving average will be. There is no time frame that is perfect for every trader and every strategy.
Traders using moving averages usually experiment with various time periods in order to find one, or multiple, that suits their trade strategy.
If you are interested in learning more about options trading in general, consider becoming part of the Capital Discussions community. There are classes, trade services, and numerous trading groups where traders of all experience levels share their trades. https://capitaldiscussions.com/join

