
Gamma is the delta of the delta. Gamma will measure approximately how much the delta changes with a price change in the underlying stock. Gamma and delta are related because gamma measures how much the delta will theoretically move. As gamma increases, it can affect the profit/loss of a position dramatically.
A stock will change in price throughout the day. So how do we know how much the delta of an option will change as the price of the underlying moves? We use gamma. Gamma determines approximately how much the delta of an option will change with a $1.00 move in the underlying.
To define gamma we first must describe delta. Delta has a few definitions; for the purposes of this article delta measures the price movement of an option with a $1.00 movement in the underlying . So if we have a .48 delta option and the underlying stock moves $1.00, the option price should move .48 in value. Please go here for a more detailed explanation of delta.
Long Gamma and Short Gamma
There is long gamma and there is short gamma. When you buy an option, either a call or a put, you are long gamma. When you sell an option the opposite is true. By selling an option you are short gamma.
Long Gamma Trades
If you are long gamma and the underlying increases in value, the delta of the position will increase by the amount of your gamma for each $1.00 move in the underlying stock. If the underlying decreases in price, the delta of the position would decrease by the amount of the gamma per $1.00 movement in the underlying stock. So if the underlying went up and you are long gamma, your delta would increase. If the underlying went down and you are long gamma, your delta would decrease.
Short Gamma Trades
When a position is short gamma and the underlying goes up, the position delta will decrease. If a position is short gamma and the underlying goes down, the position delta would increase.
Here's an example of gamma …
SPY is trading at 206.32
Using the delta of .48, each $1.00 move in price will change the option price by .48.
SPY increases in price by $1.00 to 207.32.
Since the stock has increased $1.00 in price, the option strike that was valued at 1.27 is now valued at $1.75 (.48 delta) +1.27(previous value of option).
To calculate how much the delta will increase with the $1.00 move, take the gamma of .09 + .48 (original delta) which will equal the new delta of .57.
Gamma and Time
Gamma is affected by time. The closer the option gets to expiration, the higher the gamma. An option's gamma is highest in the front month. Gamma also is highest at-the-money or near-the-money. There can, however, be an exception to gamma being highest in the front month which will be discussed later in this article.
Gamma will tend to decrease as you progress away from the at-the-money strikes. As price goes further in the money or further out of the money, gamma will tend to decrease.
Refer to the gamma column in Figure A below which shows a 9 DTE put option chain, and compare it to Figure B which shows a 24 DTE put option chain for SPY to see how gamma is affected by time. Also notice the relationship of gamma at-the-money and further out-of-the-money.
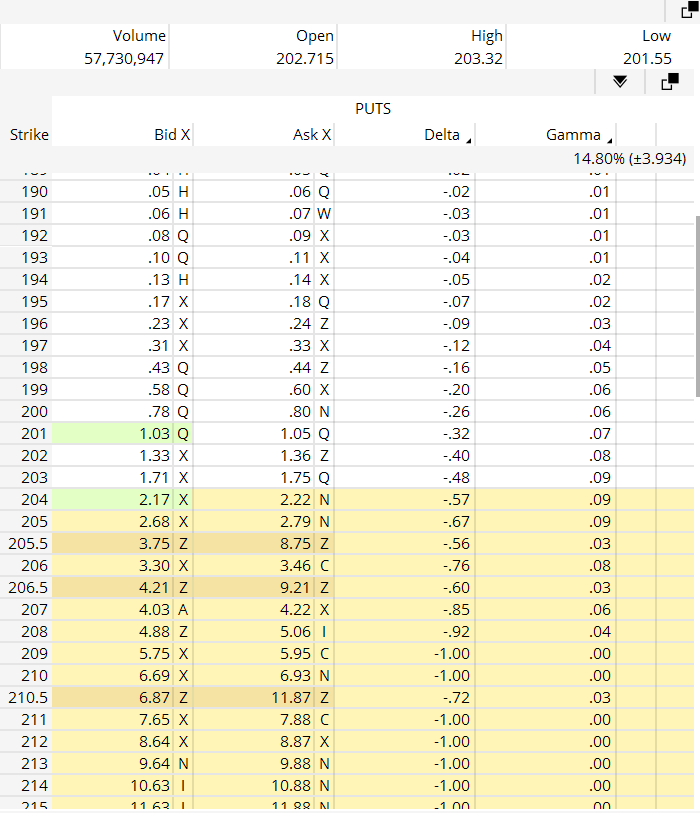
Figure A SPY Put Option Chain 9 Days To Expiration
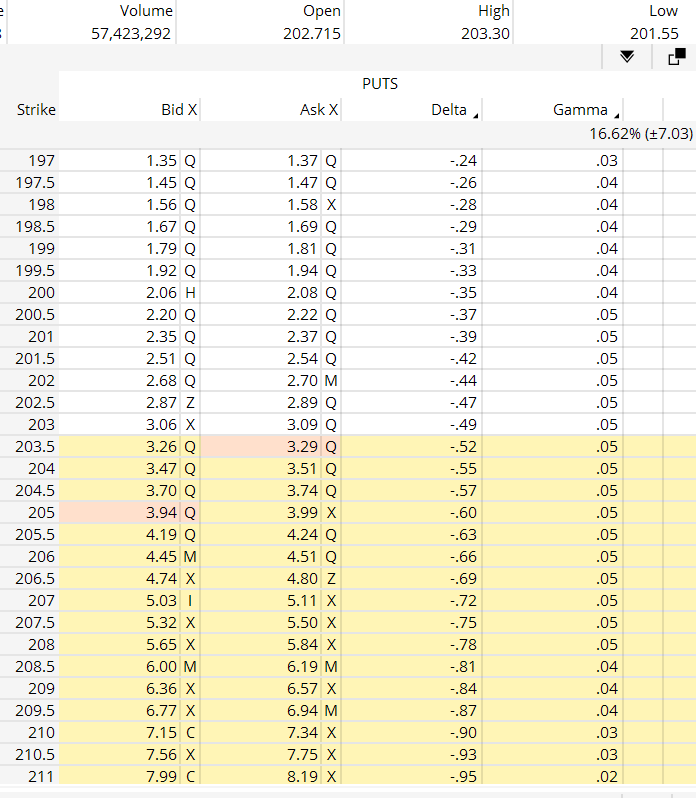
Figure B Spy Put Option Chain 24 Days To Expiration
Exceptions to the effect of gamma over time?
As you look at time over different expirations, gamma will decrease with the further out in time option expirations. Generally, gamma is highest in the front month. There can, however, be instances where back month options can have higher gamma than the front month. This may occur because very deep in- the-money options can act like stock, and stock has no gamma.
Gamma and Multiple Options
Gamma can also have an effect on a trade which has multiple options. There is gamma for each option strike in the position. Most trading platforms which combine the gamma for each option and calculate the position gamma. The platform will automatically calculate the long and short gamma for each option to determine the position gamma.
Some say gamma is a measure of how frequently a position needs to be adjusted. Visually gamma can be seen in a risk graph. When you look at the T+0 line, is it flat or curved? If the T+0 line is flat, your gamma will be less. If it is steep, you will have more gamma. Look below at Figure C which is a 7 day until expiration position, and Figure D which is a 57 day until expiration position. Notice how steep the T+0 line is on the 7 DTE position versus the 57 DTE.
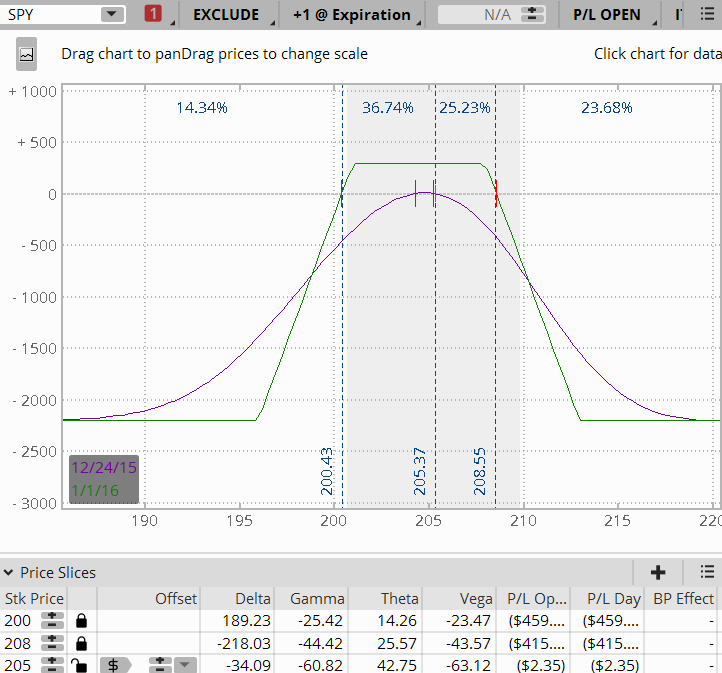
Figure C 7 DTE Position
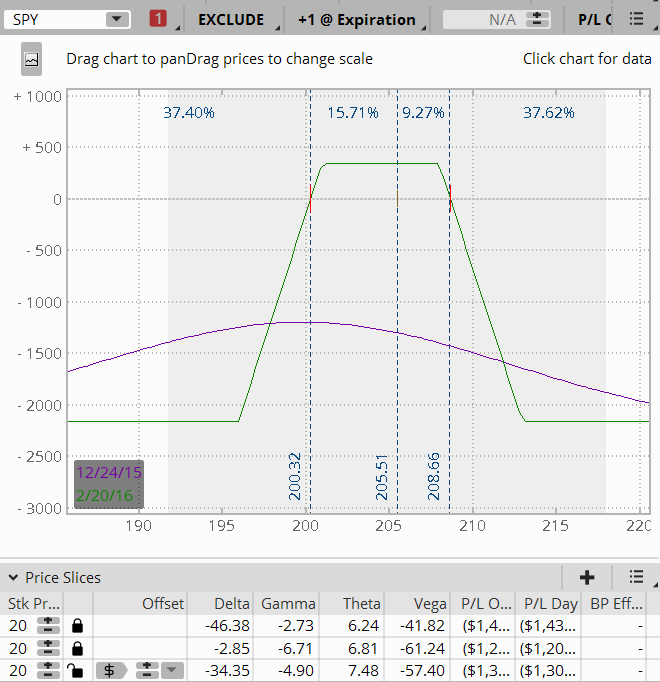
Figure D 57 DTE Position
Now that we have touched on gamma, hopefully you can apply some of this valuable information to your own trading.
Please comment below if you would like to add to the discussion.