
When you determine the difference between a stock's implied volatility and its current IV percentile, you could have an edge in your trading. This could help you become a more consistently profitable trader.
“If you want to have a better performance than the crowd,
you must do things differently from the crowd.” Sir John Templeton
What is the definition of Volatility?
- Historical Volatility is a measure of past performance. Because it allows for a more long-term assessment of risk, historical volatility is widely used by traders and market analysts in the creation of investing strategies. Historical volatility is also referred to as realized or statistical volatility. For the purpose of this article, I am using current IV percentile as historical/statistical IV.
- Implied Volatility (IV) is the estimated volatility of a particular stock/index. In general, implied volatility increases when the market is bearish, when investors believe that the underlying price will decline over time. Generally, implied volatility decreases in a bullish market, when investors believe the underlying price will rise over time. If there is a sharp move upward in price, there are instances when short term volatility may increase.
How does Implied Volatility affect Options Traders?
- Implied volatility is one of the key factors in the pricing of options. Options give you the opportunity to purchase or sell an underlying at a specific price during a pre-determined period of time. The higher the implied volatility, the more premium the option will have. The less the implied volatility, the less the option's premium.
An option's value is determined by the following components:
- Stock Price
- Strike Price
- Time to Expiration
- Volatility
- Interest Rates
- Dividends
Five of these components are easy to determine. They are basically fixed. The one which is unknown is volatility. As volatility goes up or down, it can reflect significant changes in the price of an option. Two of the most important components of an option's price are volatility and time to expiration. These two components can greatly affect your overall profit and loss. When you purchase an option, it is not enough to be right on market direction. You also have to be aware of time decay and volatility movement.
- Implied volatility has the biggest effect on the amount of extrinsic value in the price of an option. When IV increases, the extrinsic value of both calls and puts increases. This makes the call and put option prices more expensive. When IV decreases, the extrinsic value of both calls and puts decreases. This makes the option prices less expensive.
What are extrinsic and intrinsic values of an option?
- Intrinsic value is the amount by which an option is in the money. In the case of a call, the intrinsic value is equal to the current stock price minus the strike price. For puts, the intrinsic value is equal to the strike price minus the current stock price. Only in-the-money options have intrinsic value.
As an example, let's say the price of the RUT underlying is 1184.
| Price of RUT | 1184 |
| Less: RUT call strike | 1170 |
| Intrinsic value = | 14 |
- Extrinsic value is defined as the price of an option less its intrinsic value. In the case of out-of-the-money options, the entire price of the option consists only of extrinsic value.
As an example, let's say the price of the 1170 RUT call option is 25.70.
| RUT 1170 call price | 25.70 |
| Less: Intrinsic Value | 14.00 |
| Extrinsic value = | 11.70 |
Below is a RUT option chain, indicating the implied volatility, extrinsic, and intrinsic value of at-the-money and out-of-the money calls.
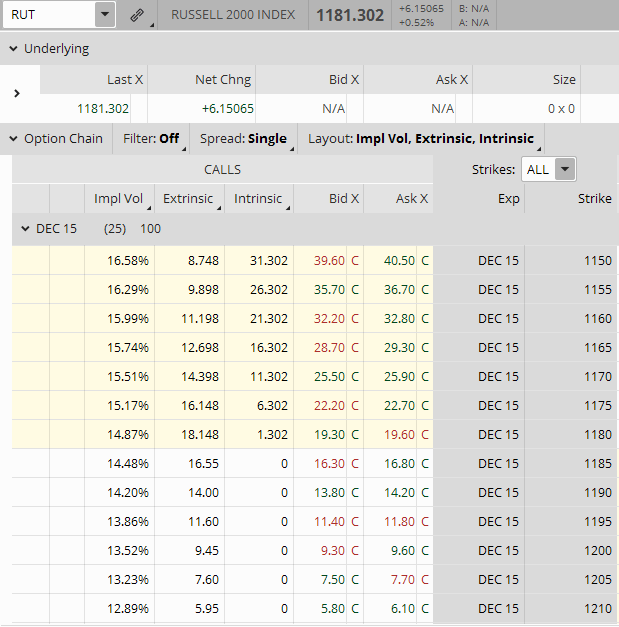
RUT Option Chain Indicating IV, Extrinsic, and Intrinsic Values
How to Determine if an Option is Relatively Cheap or Expensive
Knowing the relationship between implied volatility (IV) and current IV percentile will allow you to determine if an option is more inexpensive or expensive.
Let's start by looking at implied volatility using the Russell 2000 as an example.
The one year chart of RUT is shown below, showing the current implied volatility of 18.33%.
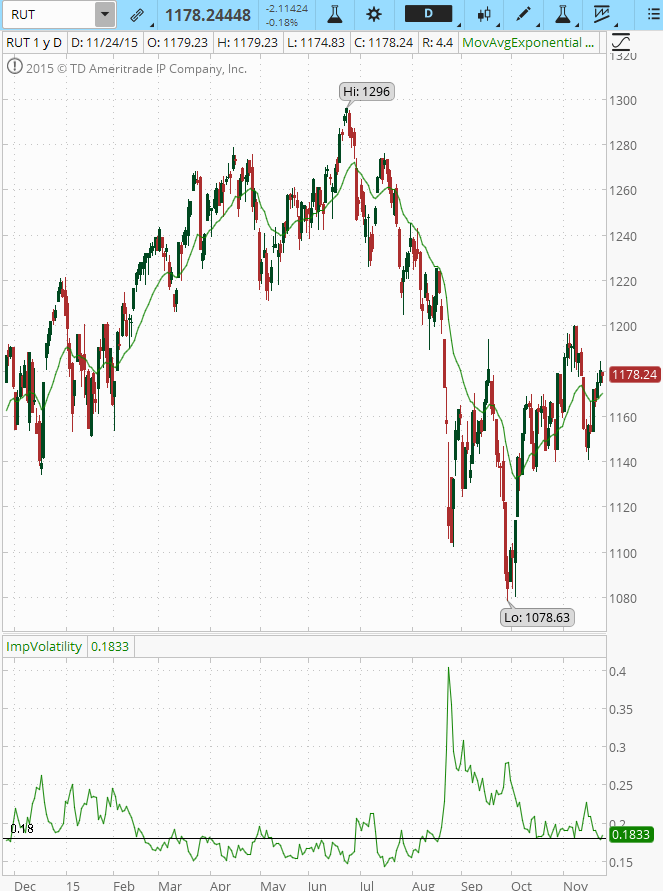
One Year Russell 2000 Chart from ThinkOrSwim
Below is a screenshot taken from the Think or Swim option chain. You can find it by scrolling down to the bottom of the option chain and look for Today's Options Statistics. It shows the Implied Volatility of 18.33%, as well as the Current IV percentile at 15%.

Today's Options Statistics from ThinkOrSwim
ThinkOrSwim calculates the Current IV Percentile by using the 52 Week IV high of 0.404 and the 52 week IV Low of 0.143. This is a historical / statistical calculation of IV over the past 52 weeks. The current IV Percentile in this example is 15%.
What does the relationship of Implied Volatility of 18.33% and the Current IV Percentile of 15% mean?
Implied Volatility is at .1833. The Current IV percentile is at 15%. So this means that 15% of the time over the past 52 weeks RUT Implied Volatility was below .1833. This indicates option volatility is relatively low. Option prices are relatively inexpensive. Therefore, it may be a good idea to use strategies with buy opportunities. You expect the price of the option to increase in this low volatility environment.
How can a trader take advantage of the relationship between Implied Volatility and Current IV Percentile?
You can base the type of trade you place using Implied Volatility and the current IV Percentile There are risks and rewards with every type of trade. A few strategies that you can take using high and low volatility levels are as follows:

High Volatility Could Indicate Opportunities to Sell
You expect volatility to decrease, thus the option you sell could decrease in price, making it profitable.
- Credit spreads. When you sell a credit spread, you will receive a higher credit when volatility is high.
- Iron Condor. When you sell an Iron Condor, you will also receive a higher credit when volatility is high.
- Butterfly. When you buy a Butterfly in a high volatility environment, your position will benefit as volatility drifts down, as long as the underlying price stays close to your short strike.
Low Volatility Could Indicate Opportunities to Buy
You expect volatility to rise, therefore, the option you buy could become worth more.
- Long put or put debit spread. This trade can allow you to lower your cost and benefit from a spike in volatility.
- Long Calendar spread. This trade could benefit from the back month volatility increasing while the front month options decay.
- Iron Condor. The Iron Condor tends to perform better in higher volatility markets, but can still do well in lower volatility markets.
There are many methods using volatility which could increase your odds of success trading. Today's article talks about just one of them. There are many volatility methods shared at https://capitaldiscussions.com/.
When you base your trade strategy on the relationship between Implied Volatility and current IV Percentile, it does not guarantee that your trade will be profitable. However, it does give you a tool to use for your trade entries so volatility can have a chance to work in your favor.
Do you have a trading method using volatility you would like to share? Please feel free to comment below.

