
The standard deviation of a particular stock or index will inform you about the possible movement over a period of time, based on probabilities.
Key factors of standard deviation
- The higher the volatility, the bigger the standard deviation.
- The further out in time the date is, the bigger the standard deviation.
- The larger the stock or index price is, the bigger the standard deviation.
These standard deviations are important to options traders because they give definitive metrics which can be used to gauge the probability of a successful trade. Of course, there is no indication of the direction of a potential move; you as a trader can use your own technical expertise and chart analysis in conjunction with the standard deviation metrics. It is also worth mentioning that no trade can have a 100% probability of success. Even trades with boundaries of profitability of three standard deviations have the small but real probability of moving outside the predicted range of movement.
“When you really believe that trading is a probability game, concepts like right or wrong, or win or lose, no longer have the same significance.” Mark Douglas
The mathematical definition of “standard deviation” is a measure of the dispersion of a set of data from its mean. The more the data is spread apart, the higher the deviation.
Represented by a bell curve, the graph below illustrates standard deviation.
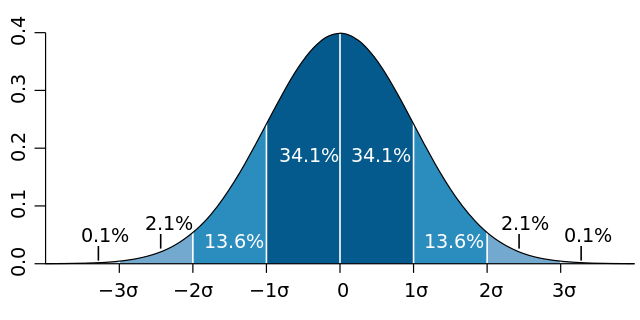
Standard Distribution Diagram
Courtesy of Wikipedia.org
Breaking this down a bit further, if the data points are all near the mean (center of the graph), then the standard deviation is close to zero. The farther away the data points are from the mean, the higher the standard deviation. The bell curve is a normal distribution, and demonstrates that among a certain number of samples, there is normal outcome. In options trading, these normal outcomes can be used as a tool.
Breaking this outcome into percentages
- +1/-1 standard deviation covers 68.2% of occurrences
- +2/-2 standard deviation covers 95.4% of occurrences
- +3/-3 standard deviation covers 99.6% of occurrences
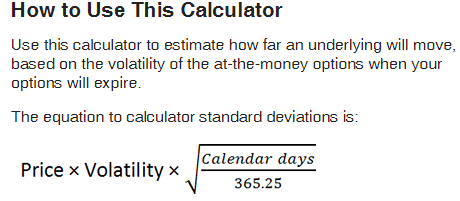
How is Standard Deviation Calculated?
Capital Discussion's site includes an excellent standard deviation calculator at:
https://members.capitaldiscussions.com/go/c.standard-deviation-calculator
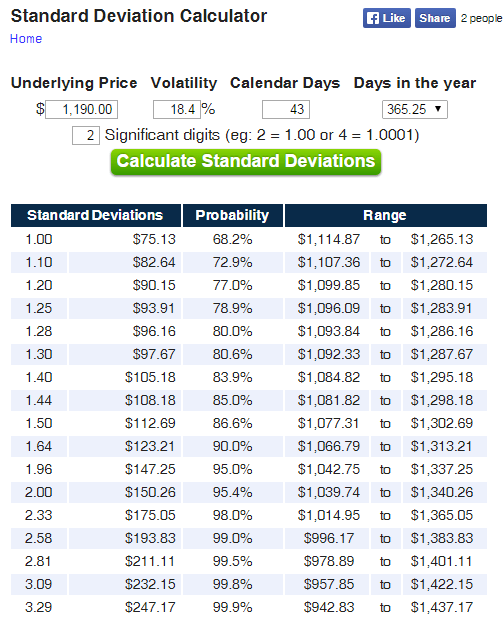
Standard Deviation Calculations for RUT December 2015 Expiration
Using RUT as an example for the December expiration (43 days away), with the price of RUT at 1190 (closing price 11/4/15), and the ATM put option IV at 18.4%, you can see how the calculator breaks down the projected price movements into increments to help determine how the various moves may affect your position.
What does this standard deviation mean for my position?
A one standard deviation on the above example is 75.13 points. What that means is any time between now and December 18 (expiration), it is possible that RUT price may be between 1114.87 and 1265.13, based on the probability calculation.
The standard deviation allows me to see where the likelihood of price movement will be during the life of the trade. Based on this calculation, there is a 68.2% probability that RUT will stay within the 1114.87 to 1265.13 price range. This, of course, relates to the data as entered today. Any time new data is entered, the standard deviation calculations are very likely to change.
Why is standard deviation important for option traders?
- If price moves a standard deviation or more in one day, or multiple days in a row, it is a sign of increased volatility in the market. This may be a time to consider reducing position size, make earlier adjustments, or adding hedges to protect the position. For example, if there is a 1.5 standard deviation move in one day, it may be in your trade plan to purchase a long call, put, or spread to protect the position.
- Standard deviation can be helpful to determine which type of trade to enter. In times when standard deviations are higher because of increased volatility, some sort of directional play may be appropriate versus a non-directional strategy such as an Iron Condor.
- Standard deviation can be used as a guideline for trade entry. For example, one of the trades in my plan consists of a Weekly Iron Condor. If the underlying has moved more than a standard deviation on the planned entry day, I do not enter this short term position.
Summary
Standard deviation is just one more tool available to options traders. It goes without saying that volatility, days to expiration, position p & l, etc. are other factors to base your trade entry, exits, and adjustments as per your own trade plan.
As always, “Have a plan and trade your plan.”
How do you use standard deviation in your options trades? Feel free to comment below.