In February, 2011, CBOE introduced the S & P 500 SKEW Index, as another means for investors to gauge market volatility and the potential risk of a “black swan” type of event. The SKEW Index is an option-based indicator that measures the perceived tail risk of the distribution of S & P 500 returns in the next 30 days. “Tail risk” is the risk associated with the likelihood of moves over two standard deviations or more below the mean. Tail risk refers to a change in price of the S & P 500 index that would put it on the far edge (tail) of the normal distribution curve. The SKEW Index measures the slope of implied volatility.
The value of the SKEW Index rises with the tail risk of the S & P 500 Index. When there is no tail risk, SKEW is equal to 100. When SKEW is close to 100, probabilities of a sharp market move remains small. As the probability of a major market move increases, the SKEW index rises.
What is the distribution curve?
The mathematical definition of “standard deviation” is a measure of the dispersion of a set of data from its mean. The more the data is spread apart, the higher the deviation.
These standard deviations are important to options traders because they give definitive metrics which can be used to gauge the probability of a successful trade. Of course, there is no indication of the direction of a potential move; you as a trader can use your own technical expertise and chart analysis in conjunction with the standard deviation metrics. It is also worth mentioning that no trade can have a 100% probability of success. Even trades with boundaries of profitability of three standard deviations have the small but real probability of moving outside the predicted range of movement.
Represented by a bell curve, the graph below illustrates standard deviation and a normal distribution curve:
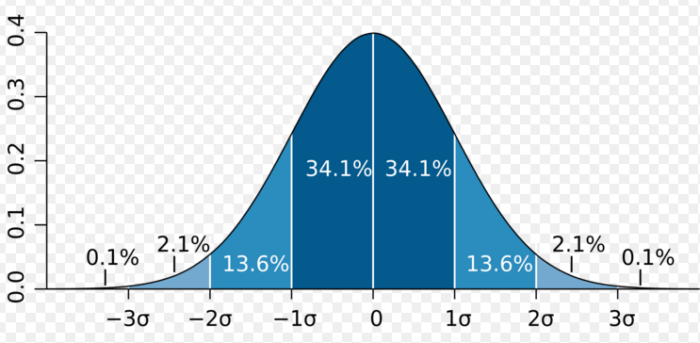
Figure A. Normal Distribution Graph (Image courtesy of Wikipedia.org)
If the data points in the distribution graph are all near the mean (center of the graph), then the standard deviation is close to zero. The farther away the data points are from the mean, the higher the standard deviation. The bell curve in Figure A is a normal distribution, and demonstrates that among a certain number of samples, there is normal outcome. In options trading, these normal outcomes can be used as a tool.
Breaking this outcome into percentages:
• +1/-1 standard deviation covers 68.2% of occurrences
• +2/-2 standard deviation covers 95.4% of occurrences
• +3/-3 standard deviation covers 99.6% of occurrences
Now, compare the normal distribution graph to ones that are skewed (to the left or the right). The chart below illustrates a normal distribution graph, as well as skewed graphs.
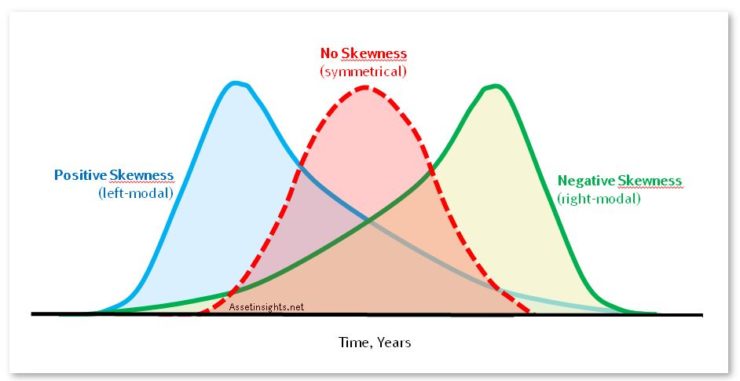
Figure B. Distribution Curves (image courtesy of assetinsights.net)
In Figure B, the Positive Skewness (curve on left) has a longer tail to the right, which indicates more tendency of upside risk. The Negative Skewness (curve on right) has a longer tail to the left, which indicates more tendency of downside risk.
How is the SKEW Index calculated?
SKEW is calculated from the prices of S & P 500 options using a similar type of algorithm as that which is used to calculate the VIX, which is the CBOE Volatility Index. The mathematical calculation of SKEW can be found here: SKEW Index calculation
The SKEW Index typically ranges from 100 to 150, with a historical average of approximately 115. The higher the SKEW index rating, the higher the perceived tail risk and chance of a significant move.
Below is a 3 year, weekly chart of the SKEW Index from Think or Swim
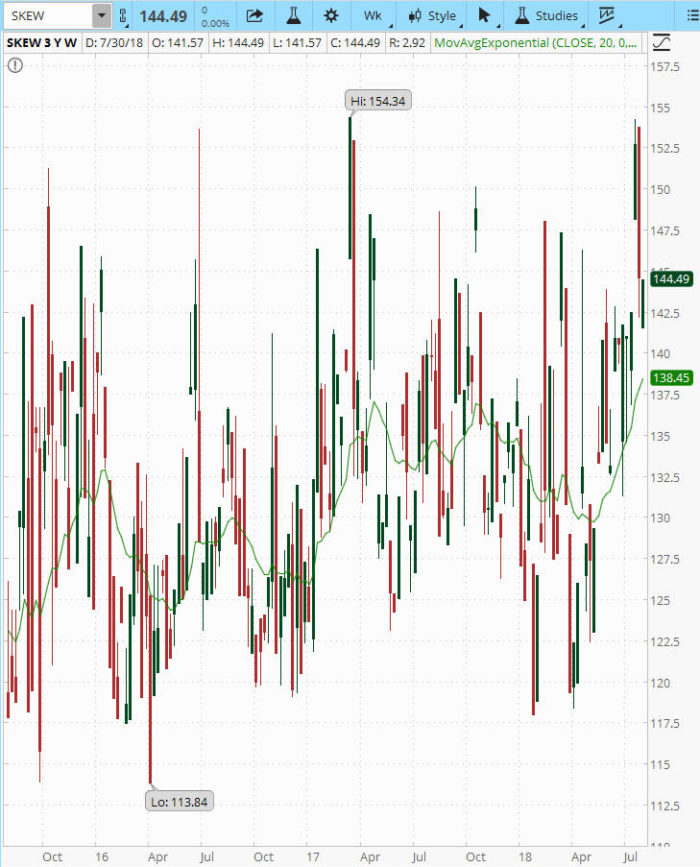
Figure C. 3 year weekly SKEW Chart
The 20 period moving average is showing a value of 138.45 in Figure C above. The current SKEW value is 144.49. Since the SKEW's historical average value is approximately 115, the current SKEW of 144.49 is higher than normal. A trader who is fearful of increasing volatility may want to be cautious.
How can traders interpret the SKEW Index?
While the SKEW index itself cannot be traded, investors may use it to help determining market risk. In general, the SKEW index rises to higher levels as investors become more fearful of a major, unexpected selloff of a large magnitude – a “black swan” event.
As the slope of implied volatility rises, the SKEW Index tends to rise. This may indicate an increase in the probabilities that a major market-moving event is forthcoming. It doesn’t, however, necessarily mean it will happen.
By monitoring the SKEW as it increases over 100, traders may choose to hedge their portfolios, add to current hedges, etc. As with any technical indicator, the SKEW index should be used in conjunction with other technical analysis such as support and resistance, volume, etc.
Is the SKEW Index related to the VIX?
The SKEW and VIX indexes are different from each other; yet complementary in terms of measuring the risk of the returns of the S & P 500 over a 30-day period. The VIX is a fairly close representation of the standard deviation of those returns, but this sometimes is not enough to measure the true risk because over time the distribution of the S & P 500 returns exceeds one standard deviation.
The SKEW index describes the tail risk of the distribution; it is a measure of the S & P 500 returns that are greater than two or three standard deviations below (or above) the mean.
Below is a one year daily chart, showing both VIX and SKEW.
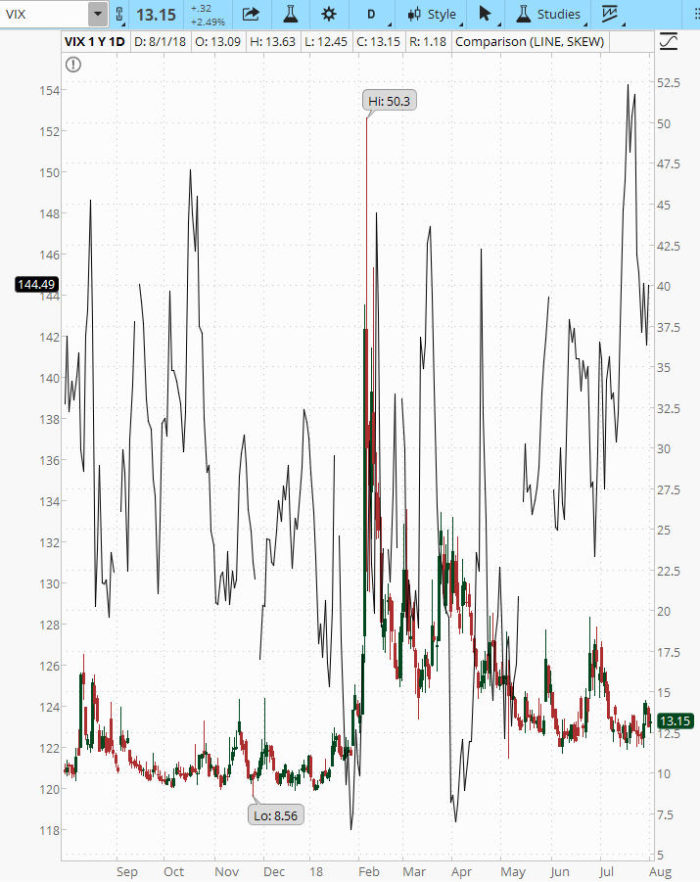
Figure D. VIX/SKEW 1 year Daily Chart
Figure D above shows the correlation of SKEW and the VIX. From late December through the middle of January the VIX was hovering around 10 (right axis). At the same time, the SKEW index was in the 120’s to 130’s (black line/left axis). During this period, SPX was continuing to move up in price, as you can see in Figure E below. A trader could interpret this to be an indication of a possible large move in price because SKEW was in the 120 to 130 range. The VIX reached a high of 50.3 on February 6th 2018; at the same time SKEW was around 133.
As with any indicator, signals can be tricky. As an example, please take note of the low price of SKEW (117.99) on January 26, 2018. At the same time the VIX was trading around 10. The SKEW had moved down to 117.99 from its’ previous higher levels, indicating less of a risk of a major market move. This occurred just before the price of SPX started to decline dramatically. A trader may interpret this as a mixed signal.
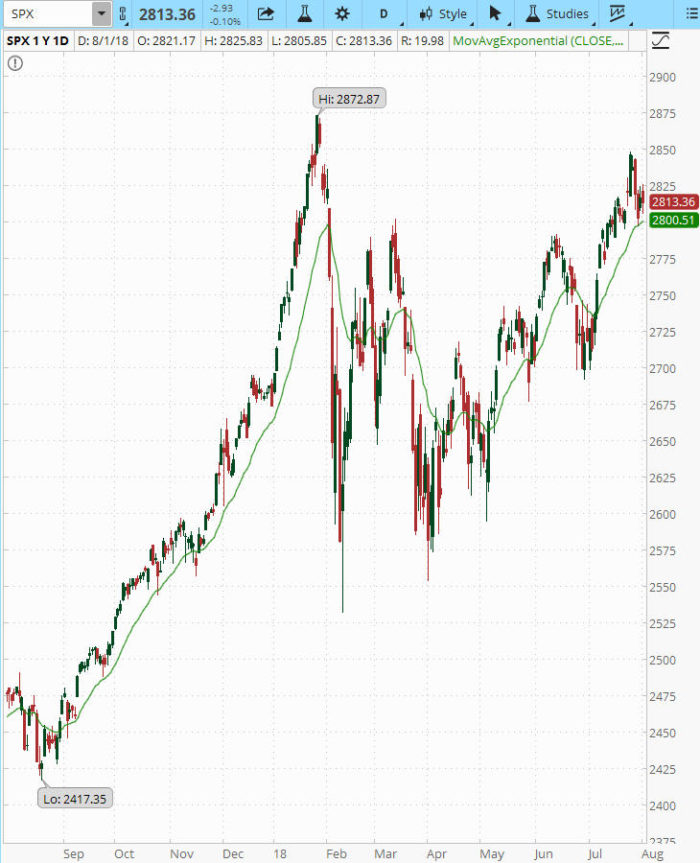
Figure E. SPX 1 Year Daily Chart
Here’s a good video to watch by Alessio Rastani, which shows other scenarios of the SPX/VIX/SKEW correlation, to forecast a potential large move in the market.
Go to…How to Predict a Fall in the Stock Market
In summary …
A trader cannot use the SKEW Index itself as an instrument to place a trade. What it can do for traders is to measure current market risk. The SKEW index for the most part ranges from 100 to 150. The SKEW Index usually rises in market uncertainty.
The SKEW Index is one more tool for traders to have available to them to make a more informed decision on their positions and portfolio.
Any one indicator you as a trader choose to incorporate into your technical analysis is not going to make you money unless you use it consistently, and this holds true for the SKEW index.
Following the SKEW index along with its relationship to the VIX, as well as price action, may give traders an insight on overall market risk.
If you have found that monitoring the SKEW index has been helpful in your trading and would like to share, feel free to comment below.
Are you looking for a mentoring program, educational alert service, or a group of like-minded traders to share both positive and negative trade experiences? Look no more, join today!
You will find a wide variety of educational services in addition to the trading groups that meet on a regular basis to exchange their trades and ideas.