Have you heard of the Death Cross and the Golden Cross in your trading career? These two crosses occur when the 50-period simple moving average crosses through the 200 simple moving average. Read on and we will explore these two terms in trading.
First we must review moving averages
How can moving averages help you as a trader?
Traders looking for areas of support and resistance many times will look at moving averages to gain a market opinion. Buy and sell orders are often placed around moving averages. These moving averages can become self-fulfilling prophecies. There are so many traders looking at these same moving averages, traders tend to observe them and react. Please note; there are no guarantees in trading: anything can happen.
A moving average is the average closing price of an instrument over a certain period of time. The time period can be any set number of bars such as 5 minutes, daily, or weekly. A moving average can also be applied to charts such as volume, tick, and range charts. A new calculation prints on the moving average line as each period elapses. Moving averages tend to lag behind as an instrument trends. The lagging takes the erratic price action of the extreme highs and lows, creating an average of the movement. This tends to create a smoother line with less chop.
What are some common moving averages?
Some of the more common moving averages are the 8-period exponential moving average, 21-period exponential moving average, the 50-period simple moving average, the 100-period simple moving average, and the 200-period simple moving average.
There are many more moving averages which each trader can use. It depends on your method of trading.
A very good video showing how the 200 simple moving average and the 50 simple moving average can act as support and resistance can be found here: 50-Period Simple Moving Average.
The 50-Period Simple Moving Average and the 200-Period Simple Moving Average can be Used to Determine the Death Cross and the Golden Cross
When a Death Cross and a Golden Cross occur, usually an X will print on the chart.
If the 50 Simple Moving Average (SMA) crosses down through the 200 Simple Moving Average (SMA), it is considered to be a bearish signal. This is often called a Death Cross.
If the 50 Simple Moving Average (SMA) crosses up through the 200 Simple Moving Average (SMA), it is considered to be a bullish signal. This is often called a Golden Cross.

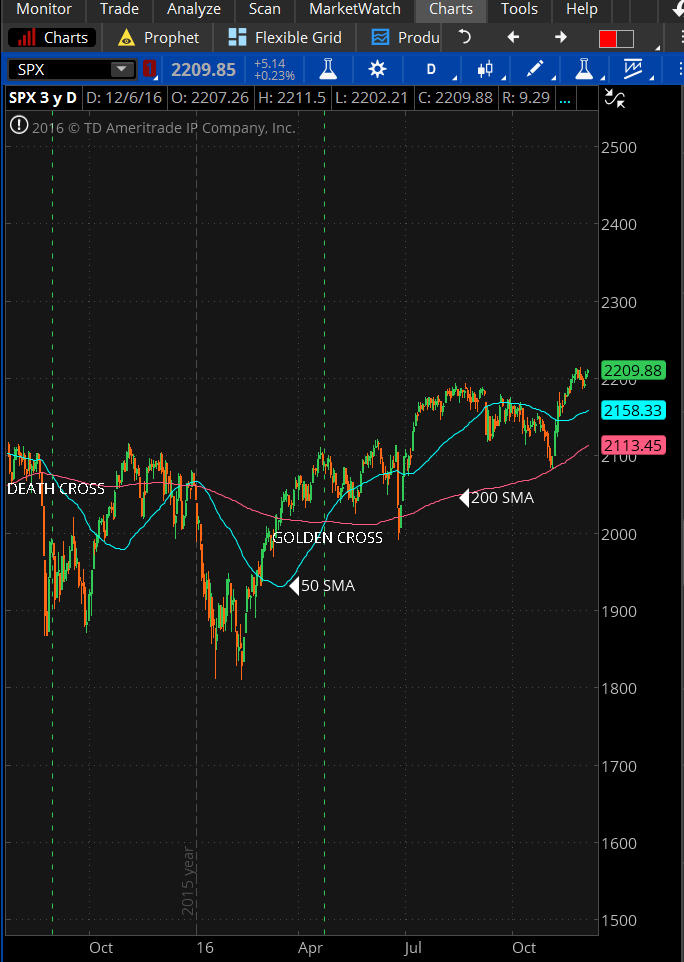
Figure A: Daily Chart SPX SHOWING A DEATH CROSS AND A GOLDEN CROSS
Notice Figure A above. The vertical green lines show a Death Cross as well as a Golden Cross. Do you see the X where the two moving averages cross?
The Death Cross occurred when the 50 Simple Moving Average crossed below the 200 Simple Moving Average. Please notice the price action as the Death Cross occurred; there was some bearish price action.
Now let's take a look at the Golden Cross as shown on Figure A. Once again, notice the price action when the Golden Cross occurred, which is a sign price should be reversing to the upside. The price action was actually moving down for a while, then moved bullish.
In Summary
The Death Cross and the Golden Cross are signals which are not always completely reliable. So traders beware. It's important to be proficient and confident in your method of trading.
When using moving averages as a basis for your trading decisions, it may be a wise decision to look at other nuances which are occurring such as price action, momentum as well as any indicators you base your trading decisions upon.
References for this article are as follows:
- Investopedia article on Death Cross
- Investopedia article on 50 Simple Moving Average
- Big Trends article on Moving Averages
Are you looking for a trading group, educational alert service, or mentoring? Look no more. Join Capital Discussions now.
Feel free to comment below if you would like to share ideas on how the Golden Cross and Death Cross have helped you in your trading.


