In this article, we’ll break down some components of Order Flow, so that you can gain a ‘ground-up’ understanding of order flow analysis and its relevance in trading.
Order flow analysis studies the factors that both cause and prevent price movement. To help you understand these processes in play, we’ll break it down without using trading jargon.
Auction Market Theory
Many people in the trading world describe the markets as an ‘auction’. You hear terms like “the market is auctioning up” – but what does that mean? Why not just say “the market is moving up”? If you take a new trader and tell him for the first time “the market is an auction”, will that trader then turn around and say “aaaaah – now I understand perfectly”? Probably not.
Per the dictionary, an auction is:
“a publicly held sale at which property or goods are sold to the highest bidder”
That definition does not fit the financial markets. In traditional auctions, people are bidding against each other for an item. Price only goes one way (up) once bidding commences. There are also reverse auctions or “Dutch auctions” where competitors bid lower prices to win business.
In both cases, we have 2 ‘sides’ and price moving one way (once a first bid has been accepted). Also, the participants are on one side or the other. If you take an item to sell, you don’t end up buying it.
The term ‘auction’ does not seem to fit what is going on in financial markets. For now, let’s put the term to one side so that we don’t get confused between ‘real-life’ auctions and what’s happening in the markets.
Don’t get me wrong, I’m not knocking the details of “Auction Market Theory” (ala James Dalton). It’s a good way to look at the market. Just that the term ‘auction’ is overused and not very helpful. Neither is claiming the market is ‘auctioning up’. It’s simply a smart-sounding buzz phrase for ‘moving up’ which provides no additional clarity or actionable information.
Let’s put the auction model to one side and discuss the forces that impact price and how they interact. Something that has a practical use.
4 Forces – A Practical Model
Financial markets are ‘4-way markets’. In other words, there are 4 ‘forces’ at play in the markets that impact overall direction. These forces are:
- Buy Limit Orders (Bids) – Weak up force
- Sell Limit Orders (Offers/Asks) – Weak downforce
- Buy Market Orders (Buys) – Strong up force
- Sell Market Orders (Sells) – Strong downforce
The first question that comes to mind is “Where are the stop orders?”. Stop orders are important but they aren’t an individual force. That’s because stop orders are simply market orders that get created when something happens. A stop order is simply an instruction to create a market order.
Unlike a regular auction, speculators will switch from being one force to another. To get into and out of the market you first buy and then sell (or vice-versa). You are participating as 2 different forces at 2 different times. Over a day, it’s quite common to participate as all 4 forces throughout your various trades.
We have 4 forces but only 2 possible interactions. Just 2 ways the 4 forces can work together:
- Interaction Up – Buy Market Orders & Sell Limit Orders (a buy)
- Interaction Down – Sell Market Orders & Buy Limit Orders (a sell)
If all interactions have a buy on one side and a sell
on the other, then that would seem a neutral event. If these interactions were
neutral, then the price wouldn’t move. They aren’t neutral because we have
strong forces reacting with weak forces. That’s where liquidity consumption
comes in…
Liquidity Consumption
The term ‘liquidity’ is one that confuses a lot of traders, let’s explain before we continue. Liquidity refers to the availability of the ‘other side’ to trade with. A liquid market is one that’s easy to get into and out of as there’s always someone on the other side to trade with when you want to enter or exit.
If we consider the 2 possible interactions above, it’s the limit orders, the ‘weak forces’ that are considered the other side. Limit orders are the liquidity. It’s as simple as that. In every trade you take, you will either be providing liquidity (limit orders) or consuming liquidity (market orders). It’s that process of consumption that is key to price movement.

In the above image, we have a strong up force, (market buyer, green), consuming the weak downforce (sell limit orders, red dots). The market buyer will consume all liquidity at one price before he can move up and consume the liquidity at the next price up.
You’ll notice there’s no liquidity beneath him. That’s because he’s eaten it. That’s why on the sell-side – liquidity only exists above us.
If we look at the other interaction – strong downforce consuming weak up force (sell market orders consuming buy limit orders), we have the opposite occurring:
ng downforce consuming weak up force (sell market orders consuming buy limit orders), we have the opposite occurring limit orders), we have the opposite occurring

Sell market orders consume buy
limit orders. When the buy limit orders have been consumed at a level, price
moves down and we eat the limit orders at the next price down. There are no buy
limit orders above us as they have already been eaten. We wouldn’t be at these
prices if we hadn’t eaten all the buy limit orders above us.
The Markets
So how does this appear outside of an 80’s arcade game? Here’s a snapshot of the DOM (Jigsaw Depth & Sales) at the time of writing:
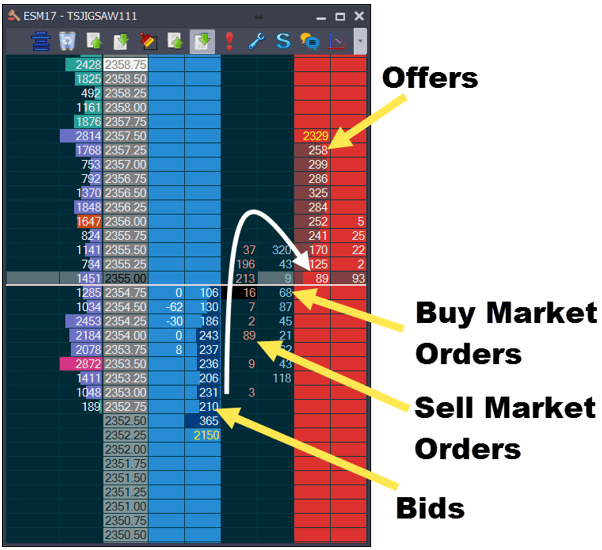
We can see the 4 forces interacting. The weak/stopping force of the bids and offers and the strong moving force of the market orders.
We can see that the bids and offers are around the same size but smaller the closer we are to the inside. That’s quite normal.
Price had moved up to 55.50 and then rolled over back down to 54.75. (Note that the market order numbers there are not cumulative). On the way up, we can see more buy market orders than sell market orders, as we’d expect. We can also see 21, 45, 87, 68 contracts traded to successively move up through each level. Then at 55.50, we see 320 contracts trade and there were no more moves up.
This is the stopping force in action. The buy market orders continued but the offers stayed firm and absorbed the buying. Now we see the market moving down. This highlights why you need to keep an eye on all four forces and not just the balance of trade.
Visual view
This is the same activity but a visual/historical perspective (Jigsaw Auction Vista).
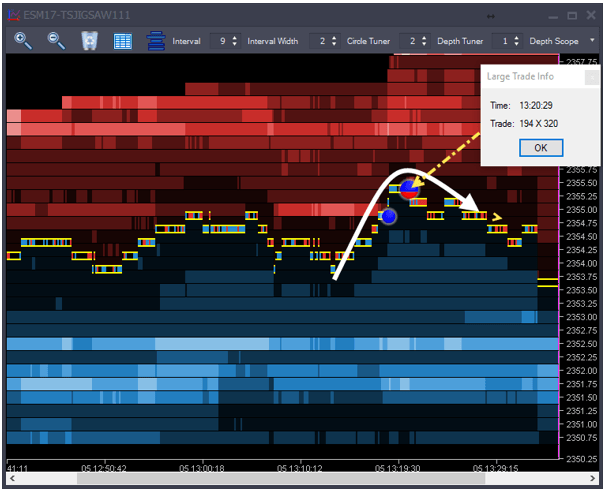
The horizontal blue and red areas are the bids and offers (with lighter colors being stronger areas).
We can see that there aren’t any significant areas of liquidity around the prices we traded (yellow lines).
What we can see at the top of the move is the blue/red circle. It shows that an abnormally large amount of trade for the time of day occurred there. It was mostly buying and price didn’t move up from that point. The weak force isn’t showing their hand, they are adding more limit orders as the buyers continue buying. The limit orders are effectively hiding.
There are many different order flow tools. Each shows a different perspective of the same information.
Summary
Understanding the mechanics of price movement is the first step towards benefiting from order flow. The next step isn’t necessarily ‘more theory’, although we will follow up with a full webinar where we will expand a bit more on order flow.
Please join us for a webinar on October 30th at 11 am ET.
Register for the webinar
In the end, there will be a Q&A where Peter will help with your questions.
Peter Davies
Jigsaw Trading – https://www.jigsawtrading.com