We've had some interesting discussions in our forums about the market topping. Garret is a long time Gann trader and showed us his charts that predicted the SPX topping on June 23 at 1959. The peak yesterday was 1968.17, one day off from Garret's prediction. Considering he did this a long time ago, it is very impressive!
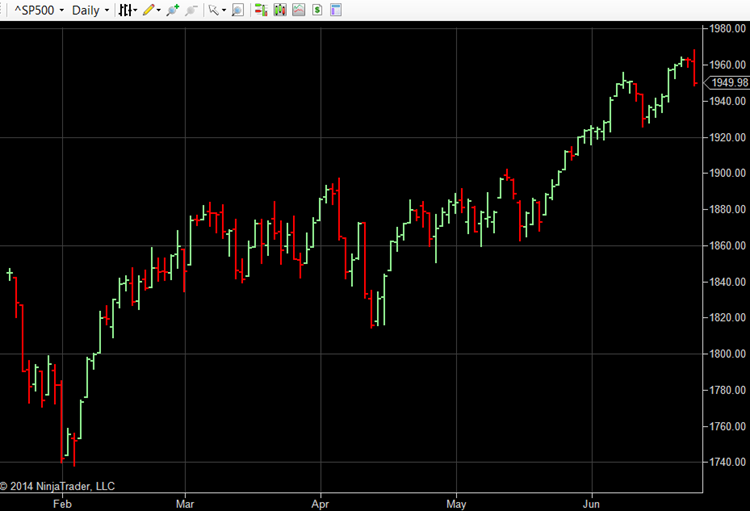
Markets climb the wall of worry. In the face of an abundance of negative news, the markets keep climbing. At some point the markets will have a meaningful correction to the down side. Is this down move yesterday the start of the “big one?” No one knows. This weekly chart of the SPX doesn't show the SPX in any danger quite yet but it slowly to show weakness.
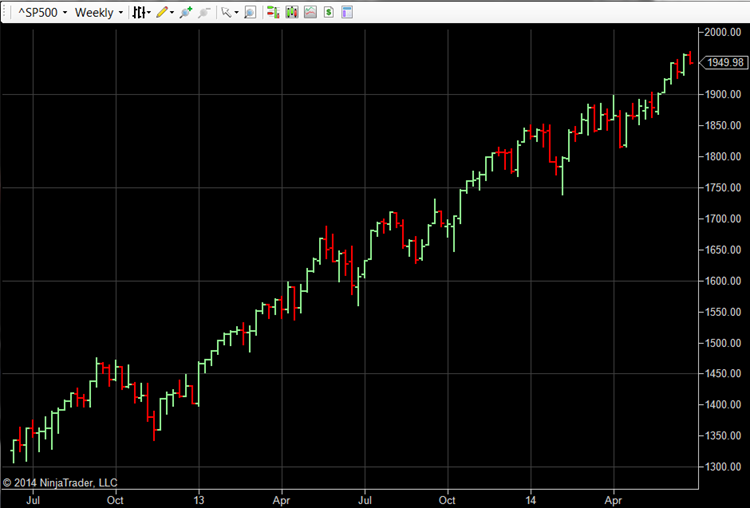
The weekly chart could change quickly with a several swift down days. As Garret said in his forum post, use stop-loss orders in case you are wrong.
2B Reversal?
I'm looking for a 1-2-3 high which could be forming. One of the better reversal patterns is a 2B Reversal pattern. Here's what it looks like:
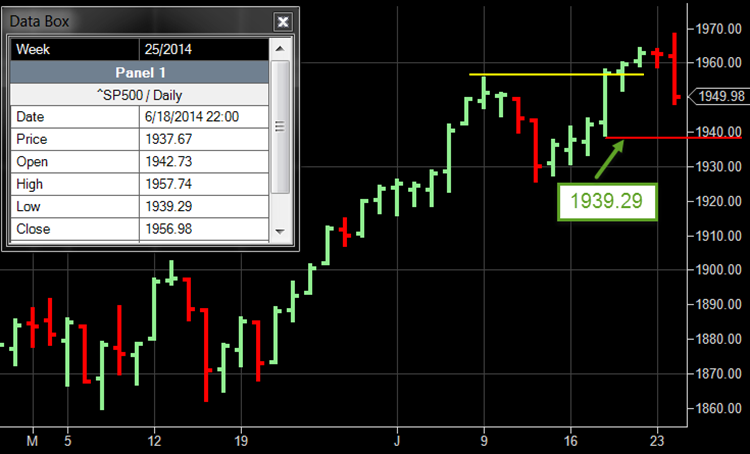
The bar that SPX took out the previous high (the yellow line) is the trigger bar. The low of that bar is used to go short if SPX trades below the red line (1939.29). I will short the SPX if it gets below 1939.29 and maybe before that. It looks like we could develop into this reversal pattern soon.
What is your opinion?
I created a poll in our forums to see what we think as a group if the market has topped or not. It's a one question poll and you can vote here.

The market invalidated this signal and keeps rallying. I’ll keep looking for signs of a top.