The S&P 500 options settle on Friday morning of the 3rd Friday of each month. The CBOE publishes the official settlement prices.
Option Elements used to publish the settlement data but that website is now defunct. (NOTE: The Spanish Option Elements is still active)
Since it was pretty interesting information, I thought I should build one like it to keep the information flow going.
The settlement data page I built is at https://aeromir.com/settlement
The data in available for:
- Dow Jones
- Russell 2000
- S&P 500
- S&P 500 PM Settlement
- VIX options
Anyone can access the page. If you aren't signed into the member's web site you'll only see the current and previous year's data.
Free members of the Aeromir community can access the last five years.
Gold members can access all of the data, which goes back to May 1998 for the S&P 500 index.
The next settlement date is approaching on Friday. With the very large market down move, it should drastically change the numbers for this year. Will it be as large as the changes in the past? We'll see.
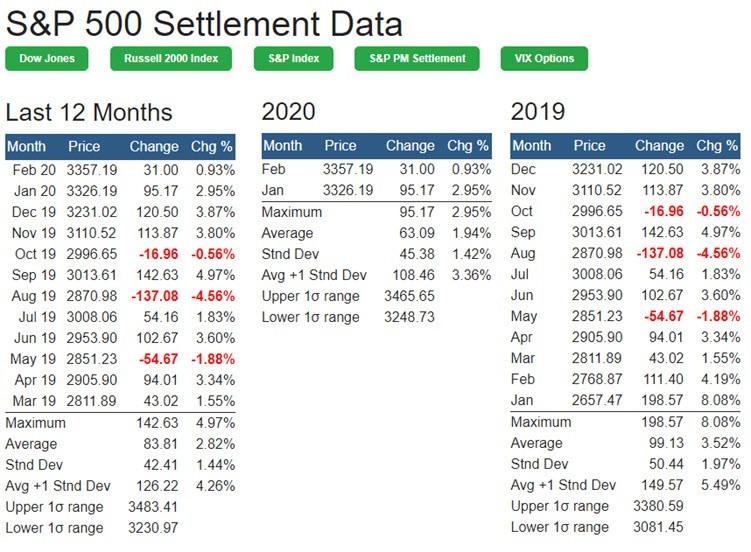
The data shows each month's price, change from the previous month and the percent change. It's important to use percentage so you can compare the same index even if it has doubled or tripled in value since the earliest data.
The standard deviation of movement is calculated and shown with the average and maximum move during the year. A one standard deviation up and down range is also calculated based on the last price in the column of data.
Here's an example for 2019 of the S&P 500 Index:
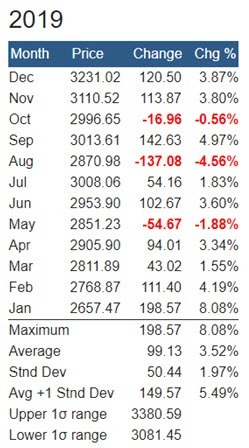
The average move each month was 99.13 points or 3.52%. The standard deviation was 50.44 points. Adding 99.13 and 50.44 is the “Avg +1 Stnd Dev” number, or 149.57
Adding 149.57 to the Dec price of 3231.02 is an upper one standard deviation range of 3380.59.
Subtracting 149.57 from the Dec price of 3231.02 is a lower one standard deviation range of 3081.45.
The index prices the following Jan should be in the range 3081.45 to 3380.59 about 67% of the time.
This information is useful in helping you place your non-directional options positions.
For example, if you like trading bearish butterflies, you might place your upper long put strike near the 3081.45 price and setup the butterfly below that.
Remember there are no guarantees of the price behaving and staying in the one standard deviation range.
Case in point is the current month. The S&P futures are currently limit down at 2555, which is 680 points below the Feb settlement price! That's a -21% drop!
As a trader, you still need to be mindful of the risk in your positions and manage that risk. You can use this table to help guide your trades as it is based on historical information of what the market actually did. Not what people think it might do.
I hope you enjoy the new data.