Let me ask you a question. Which position is more risky?
- Selling a Covered Call
- Selling a Naked Put
Most people would say selling a Covered Call is a great investment strategy, but selling a Naked Put is terribly risky. If you understand Option Synthetics, you'll know that these two positions are exactly the same!
How can that be?
It is because of the mathematical relationship between Calls and Puts. You can use either Calls or Puts to construct identical positions. To understand how this is possible, you have to understand that mathematical relationship first and what option synthetics are.
According to the Merriam Webster online dictionary, the definitions of “synthetic” include:
– produced artificially
– devised, arranged, or fabricated for special situations to imitate or replace usual realities
This is exactly what option synthetics are: artificial or fabricated positions. They imitate or replace another position. To understand how option synthetics work, we have to examine the basic relationship between puts and calls. It is a strict mathematical relationship:
K + C = U + P + I + D
Where
K = Strike Price
C = Call
U = Underlying stock price
P = Put
I = Interest
D = Dividends
Normally, the effects of interest and dividends are small and can be ignored. There are situations where interest and dividends affect this equation:
– If you are trading in times with higher interest rates (remember when the prime rate was 20% in 1980?)
– Trading with longer time frames (such as LEAP options)
– Investing in dividend producing stocks
In these situations, you can't ignore Interest and Dividends. For our shorter term trading with very low interest rates, we will take Interest and Dividends out of the equation. This leaves:
K + C = U + P
Because the strike price is a constant value, let's remove it from the equation to simplify the examination the call, put and underlying price relationship:
C = U + P
In this equation, positive values (+) are long and negative values (-) are short. This means:
+C = Long Call
-C = Short Call
+P = Long Put
-P = Short Put
+U = Long Stock
-U = Short Stock
 This simplified equation let's you derive the six basic synthetics relationships very quickly. If you remember from basic algebra, moving a variable from one side of the equation to the other side, changes its sign. My 8th grade teacher called it “jumping the fence”). Let's see what that looks like:
| Long Call | = | Long Stock + Long Put | +C | = | +U + P |
| Short Call | = | Short Stock + Short Put | -C | = | -U – P |
| Long Put | = | Long Call + Short Stock | +P | = | +C – U |
| Short Put | = | Short Call + Long Stock | -P | = | -C + U |
| Long Stock | = | Long Call + Short Put | +U | = | C – P |
| Short Stock | = | Short Call + Long Put | -U | = | -C + P |
Using Synthetic Positions as Substitutes
Case 1: Synthetic Covered Calls
If we reference the table above, we can see that a Short Put = Short Call + Long Stock. Let's compare
- Long Stock
- Long Stock + Short Call (Covered Call)
- Short Put (Synthetic Long Stock + Short Call)
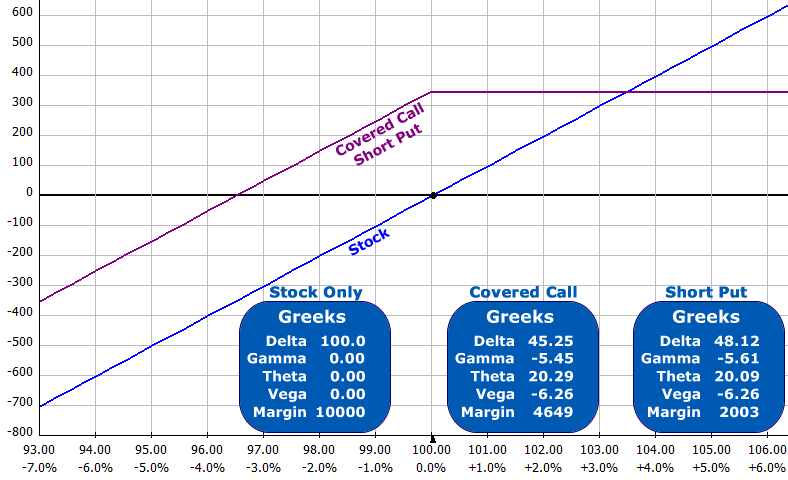
NOTE: The differences between the Greeks for the Covered Call and Short Put are due to OptionVue's rounding of the option mid-prices to the nearest $0.05
We see the margin for the Long Stock is the highest, then the Covered Call (using 50% margin) then the Short Put. The temptation is to use the same amount of capital selling short puts that you would have spent on the Long Stock or Covered Call. You could sell five short puts for nearly the same amount as buying 100 shares of stock. You would be very highly leveraged if you did that. Your profits and losses would be magnified by five times! Avoid that temptation!
Case 2: Collar vs a Vertical Spread
A collar is Long Stock and sell a Call and purchase a protective put. Using our algebraic notation the position is:
U + P – C
If we group them like this:
[U + P] – C
We can use the synthetic equivalent of Long Stock + Long Put, which is a Long Call:
[+C] – C
We have a Short Call and a Synthetic Long Call. These are at two different strikes so we have a vertical spread:
For example, on Dec 8, 2011, Goldmann Sachs (GS) was trading at $100.03 during the day. The option prices for the options with 9-days until expiration were:
105 Calls = $1.60
105 Puts = $6.60
95 Calls = $6.60
95 Puts = $1.60
If we own the stock we can sell the 105 calls for $1.60 and purchase the 95 puts for $1.60 for a net $0.00. This “collars” our stock. We have limited our upside profit potential but reduced the maximum loss on the trade.
If we sell the same 105 Calls for $1.60 and purchase the 95 Calls for $6.60, we have a net debit of $5.00.
If we sell the 105 Puts for $6.60 and buy the 95 Puts for $1.60, we have a net credit of $5.00
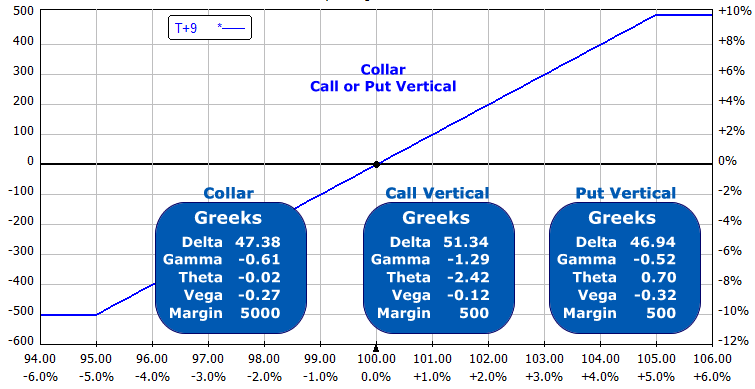
All of the positions have the exact same risk! Notice the margin for the call or put vertical spreads are both $500 vs the stock margin of $5000 (with 50% margin). The temptation exists for buying 10 verticals, but this has 10 times the profit and 10 times the potential loss!
There's little reason to collar a stock unless you want to hold the stock for dividends. The short call could be a problem if the stock rallies and you want to keep the stock. You would have to buy back the short call at a loss before the short option was assigned to you. If you are considering collaring a stock, also consider selling the stock and putting an option-only vertical spread on instead.
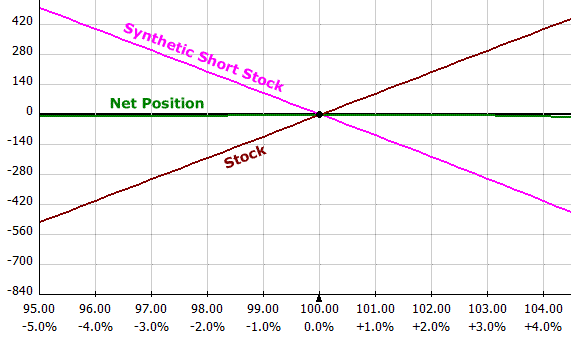
Case 3: Shorting a Stock Synthetically
Suppose you own Long Stock and the company is going to report earnings but you're going on vacation. How can you hedge your position without selling your stock? You can short the stock synthetically with options!
Short Stock = Short Call + Long Put
If you pick the same strike for your short call and long put, you have a synthetic short stock position. If you split the strikes, you have a flat risk chart in between the two strikes. Because you own the Long Stock, you are creating a collar (see Case 2 above).
For example, if your stock is at $100 per share and the you sell a 105 Call and buy a 105 Put, you have zero risk (and zero profit potential). Your risk chart is a flat line. Here's what it looks like:
Conclusion
There are many uses of synthetic options and it is very useful to know the relationships of C = U + P. It's easy to quickly figure out what the synthetic equivalent is by putting one variable on one side of the equation.
Have you used option synthetics? Do you have any questions about them? Leave your comments below or post them in our online discussion forums.

I drop a leavve a response whenever I especially enjoy a post
onn a website or I hawve sonething to add to the conversation. Usually it is a result of the fire communicated in the post I looked at.
And on this article Option Synthetics Primer. I waas eccited enough to post a
comment 😛 I do have a couple of uestions forr you if it’s okay.
Is it onjly mme or does it look as if like some of these responses lookk as if they are written by brain dead people?
😛 And, if yoou are posting at additional places,
I’d like to follow everythig fresh you have to post.
Could you make a list ever onne of all your public pages like your Facebook page, twitter feed, or ljnkedin profile?