
One of the advantages of an option based approach to trading is the ability to capitalize on trades that have a statistically well-defined high probability of profit. When events occur with predictable regularity, the knowledgeable option trader can effectively increase his odds of success.
One of the most reliable and reproducible events occurring in an option chain is the rise of implied volatility (IV) that occurs as the earnings release date approaches and its collapse immediately following earnings release. It is this run up in IV and its dramatic decrease once earnings have been announced that forms the basis for high probability option trades.
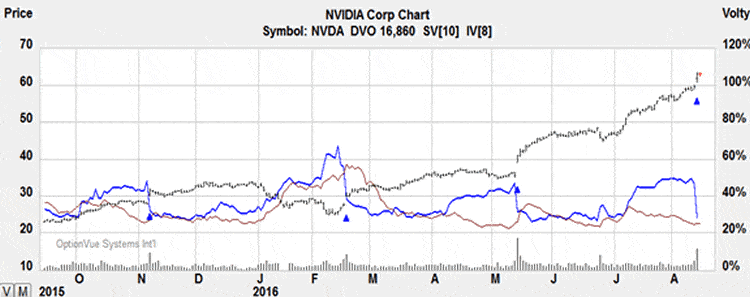
This pattern of ebb and flow is clearly shown on the chart presented below of chipmaker NVDA. Note that spikes in IV (the blue continuous line) occur precisely before earnings (blue triangles) and rapidly fall to significantly lower levels immediately after earnings.
Another observation from this chart is that the magnitude of the IV spike in anticipation of earnings release is not always the same. Since the peak may be variable in size from one earnings cycle to the next, not every earnings release may set up as high probability candidate for trading.
Another aspect important to recognize is the horizontal skew induced in the options chain; this skew is quite variable as regards different underlyings. Again with NVDA as our example, consider the options matrix below, a snapshot of the IV situation at market close on Thursday August 11 in anticipation of earnings release to follow the closing bell (OptionVue labels IV as MIV).
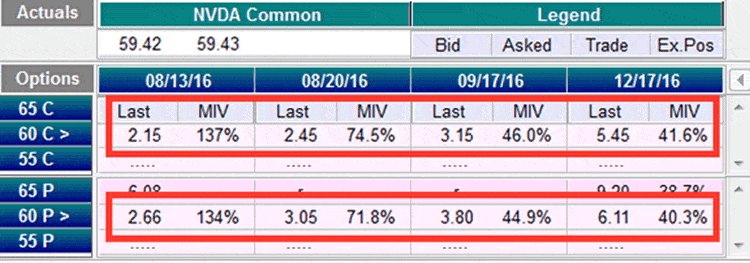
NVDA before earnings release
Consider then the second matrix showing volality 24 hours later after earnings have been released. Note the dramatic reduction in the IV of the longer dated options. OptionVue does not calculate IV on options expiring in less than 24 hours, but the fact that both the put and call are trading within pennies of intrinsic value indicates a very low IV as well as the short amount of time remaining in the option’s life.
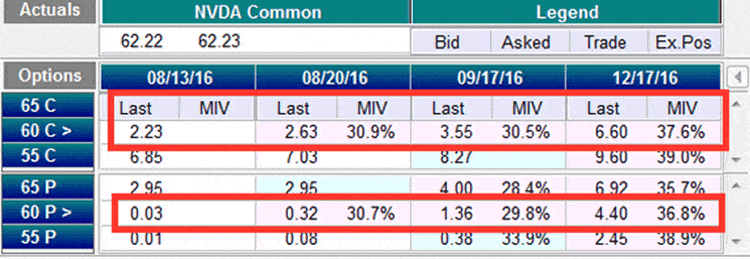
NVDA after earnings release
A couple of take home messages are important here:
- IV rise and collapse is most extreme in the first option series expiring following earnings release.
- IV rise and collapse not only effects the front series but affects other expirations as well, albeit to a lesser but variable degree.
As Joanna White’s excellent blog post of March 5 this year discussed, these large changes in IV have a huge impact on the price of an option. Certain earnings strategies suggested by some writers, for example buying a calendar spread, can be severely negatively affected by this decrease in IV in the option in which you hold a long position.
The most important factor to consider when selecting candidates for earnings trades is an understanding of current levels of the IV in relation to the historic range for that specific underlying. Remember that each underlying has its characteristic range of IV. The changes occur in a heartbeat following earnings release, and there is no time to react to resurrect the trade.
In upcoming articles on this topic I will discuss an approach to gathering necessary data and designing a high probability trade to take advantage of this stereotypic sequence of events. However, do not think for a moment that is “free money”; it is a trading strategy with a high probability of profit but no guarantees.

Nice article. I really want to see the sequels to it that explain how to take advantage of this regular and predictable rise and fall of the IV.