This week's article will be an overview of what is a broad subject; technical indicators. Subsequent articles will cover some of the more popular indicators in detail, but we will cover the basics to start.
Many traders use technical indicators to some degree to help them in their market analysis and trade management. Technical indicators are like a weather forecaster. They don't tell you what is certain to happen, but are a guide to prepare you what may “likely” happen.
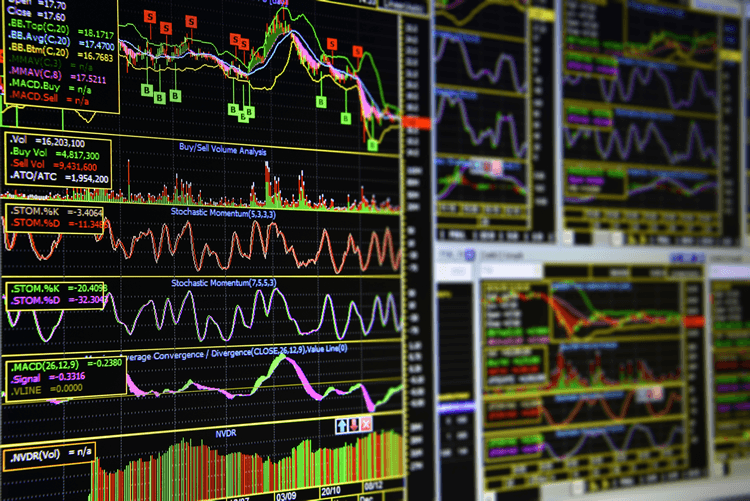
Technical indicators are formulated by entering information such as price and volume into a mathematical formula. This formula produces a data point. Data points are collected over a period of time. Technical indicators can be found above or below charts. Others are plotted on top of the prices on the chart. A few popular technical indicators are shown on the chart below:

SPX Chart showing 50-Day and 200-day Moving Average, MACD, RSI and Williams %R
Traders who use indicators look for them to help predict where prices may be heading. Some indicators show whether or not the underlying is “overbought” or “oversold”. Being overbought or oversold does not always mean that the underlying will continue to stay there, or reverse.
- Overbought: This is a technical condition that happens when there has been a lot of buying, and the price of the underlying is considered to be too high; making it susceptible to a decline.
- Oversold: This technical condition occurs when there has been an abundance of selling, hence the price is viewed as being too low. This brings anticipation that a rally in price is expected.
In general terms, many traders use technical indicators for two things:
- To generate buy and sell signals
- To confirm price movement
What are the main types of technical indicators?
Leading Indicators precede price movement. These are often used as a general buy and sell signals. Most leading indicators represent some form of price momentum over a given period of time. Leading indicators are affected more by recent price changes, and tend to generate more signals which allow more opportunities to trade, than lagging indicators. Some of the more common leading indicators are Stochastics, Williams %R, and the Relative Strength Index.
Leading indicators at times can allow a trader to enter a trade early; possibly making greater profit. However, they are not “always” right. When they are wrong, you can lose more money relying on them, because you are entering and exiting trades more quickly.
Sometimes, what you think will happen doesn't always happen. That is where another type of indicator, the lagging indicator, may help.
Lagging Indicators are a confirmation tool because it follows the underlying's price movement. It happens “after the fact. After prices have been trending for a period of time, the lagging indicator may produce a signal that the trend may be changing. It solidifies at a certain point, and then the confirmation is more apparent that the trend is, in fact, changing. Two of the more common lagging indicators are: MACD and Moving Averages.
In summary
There are so many technical indicators out there for traders to use today, entire books have been written on the subject. Trading platforms have dozens and dozens of choices for traders to use in their trading, and some traders write their own scripts for technical indicators. However, many traders feel that the “King and Queen” of indicators is twofold and very simple…price and volume. A non-technical trader may see technical indicators only as a mathematical formula with data points plotted into them and may choose not to use them feeling that the formulas can be manipulated. Instead, they may choose to just use price and volume which tells the true story… created by real investors buying and selling the underlying.
Technical indicators are a terrific tool for traders to use as an adjunct to price and volume and are most often used as a guideline – not a rule – in trading.
Future articles will cover some of the popular technical indicators in a bit more detail.
If you are new to trading and looking for strategies and feedback from veteran traders, consider joining the community of options traders at Capital Discussions. Get started at https://capitaldiscussions.com/join.
Feel free to comment.
