
Market profile can be used by both short and long term traders. For the most part, market profile is based on information derived from price and volume. Market Profile compiles information from the past and combines it with the present to help forecast the potential future. This information is gathered and provides areas on a chart to help a trader formulate a trading bias.
Market Profile originated in the futures industry back in the early 1980’s. It was created by The Chicago Board of Trade. Time, Price and Volume are combined and shown on a chart in a statistical distribution similar to a normal bell shaped curve. Many traders use market profile as an essential tool to assist them to evaluate an underlying. Market Profile can help a trader to gain some clues for a better understanding where the value areas are in a market.
It takes time and commitment to become a master at market profile. As a trader becomes more familiar with using market profile, more proficiency will be obtained. Market profile is not a market signal, but rather allows a trader to get a feel of the context to the underlying being evaluated.
It is a way to look at the market. It can allow a trader to look at the market in depth. Market Profile, along with market context, can help a trader to develop confidence in their trading. This can assist a trader to get into higher probability of profit trades.
One method to find clues to market context can be found by observing a higher timeframe to view the underlying, looking for the overall trend along with support and resistance areas. If the trend is over extended with the possibility of reversing, this should be noted. The trader then applies the knowledge obtained by observing the higher timeframe to the shorter term timeframe to evaluate a potential trade.
The Bell Curve and its Relationship to Market Profile…
The book titled “Mind Over Markets”, written by James Dalton, defines Market Profile as “the markets activity recorded in relation to time in a statistical bell curve”. A bell curve according to Investopedia is “the most common type of variable, and due to this fact, it is known as a normal distribution”.
When an instrument has high liquidity and is viewed on a Market Profile chart, the chart will often tend to resemble a bell curve on its side.

Figure A: Bell Curve (Image courtesy of Wikipedia.org)
The standard deviation of a particular underlying will inform you about the possible movement over a period of time, based on probabilities.
Let’s look at Figure A. When the data points are all near the mean (center of the graph), then the standard deviation is close to zero. The farther away the data points are from the mean, the higher the standard deviation. The bell curve is a normal distribution, and demonstrates that among a certain number of samples, there is normal outcome. These normal outcomes can be used as a tool.
Breaking this outcome into percentages:
- +1/-1 standard deviation covers 68.2% of occurrences
- +2/-2 standard deviation covers 95.4% of occurrences
- +3/-3 standard deviation covers 99.6% of occurrences
Understanding a Market Profile Chart …
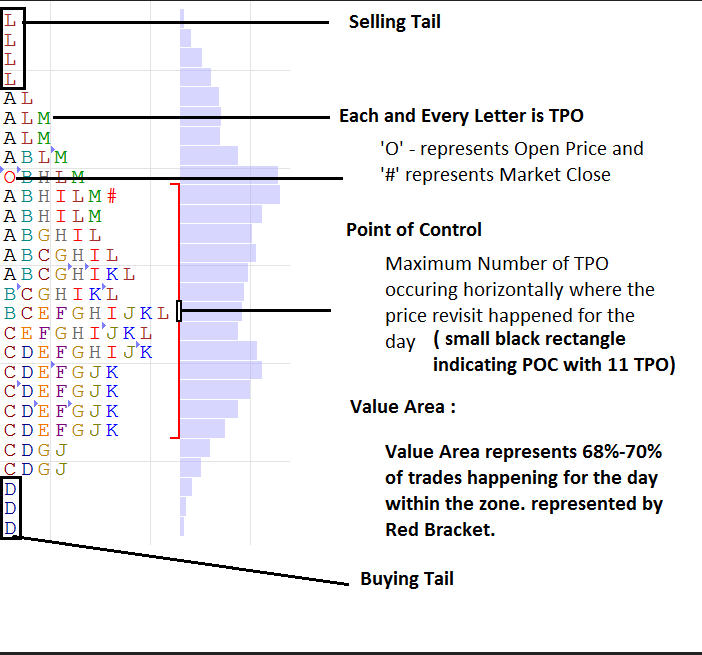
Figure B: Market Profile Chart (Image courtesy of marketcalls.in)
Figure B shows an example of a Market Profile Chart. The capital letter “O” indicates the Market Open price on the chart. The “#” symbol represents the Market Close.
Letters identify time on the Market Profile Chart. The time period labeled A is the first time period. The first time period will create a range and is called the Initial Balance. As the trading day continues, the information printed on the Market Profile chart will create patterns. These patterns are called “day types.” These patterns create shapes. These shapes and patterns are recognized by traders and often given names such as a POP pattern, a B pattern, a shoulder pattern, P pattern, etc.
Time price opportunities or TPO’s are shown in Market Profile and are defined by CBOTMP1 as “opportunity created by the market at a certain price at a certain time.“ Time Price Opportunities (TPO’s) are shown in Market Profile and represent trading activity over a time period at particular price levels.
Volume is represented in Market Profile. It can be observed by the number of letters which correspond to each TPO. This offers a trader the opportunity to observe what market participants are doing at a certain price.
The horizontal area on the Market Profile chart that has the most Time Price Opportunities (TPO’S) is called the Point of Control. The TPO’S are represented by alphabetical letters.
The Value Area shows the zone where 68% to 70% of the trades occurred during the time period. The Value Area is shown within the red bracket in Figure B.
Balanced Markets …
When price action is basically staying within certain areas or boundaries, the market is often referred to as balanced and orderly, and those areas or boundaries are often seen as support and resistance. Traders are playing within those areas on the Market Profile chart.
When a trader sees those support and resistance areas where traders are playing, the trader may use those support and resistance areas to plan and execute a trade.
Some traders may use certain areas to execute directional trades. Traders may see an opportunity when price goes beyond and outside the 68% to 70% value area, towards either the buying and selling tails(as shown in Figure B). They may choose to execute a trade thinking price will revert back to the value area. The value area often tends to be a magnet when price reaches the outlying areas.
Unbalanced Markets …
When markets become unbalanced, price action will go beyond the value area where traders were playing, a so called new play area could be forming. A breakout of the previous trading activity could be occurring, resulting in new areas of support and resistance. This could form another bell-curve or play area. A trader may choose to place trades in this new play area.
In Summary …
Market Profile charting is a tool which can give a trader context of the underlying market. Market Profile is not an indicator or a trading system. Many traders will use Market Profile along with other tools such as moving averages, patterns and shapes, candlestick patterns, etc..
“Tell me and I’ll forget, show me and I may remember, involve me and I’ll understand.”
Chinese Proverb
There are two informative books written by James Dalton, Markets In Profile and Mind Over Markets, (mentioned earlier) which you may want to explore to learn more about Market Profile. The books teach concepts, theories and strategies for Market Profile.
Here’s an informative video you may like to watch if you want to learn more about Market Profile:
Those traders who use Market Profile say it is a very valuable tool and well worth the time to learn.
If you have experience using Market Profile, please share your experience with us. Please comment below.
does anyone ever comment on these posts? i haven’t seen any. anyway, good summary on profile charts. in theory they should help in analyzing markets but i haven’t found them to be all that helpful. probably because i don’t have a lot of experience using them. i haven’t seen any of the charting web sites showing these charts. i think market profile is a registered trademark, or somehow otherwise restricted by the cbot. there are some paid sites the have them. thinkorswin has a similar concept, called monkeybars, but i find these harder to use than market profile. since i couldn’t readily find these, i wrote code to plot them on one of my web sites. i can’t call it market profile so i call it market activity. it’s not very useful, in general, because of the limited amount of historical intraday data i have access to. anyway, i keep studying them, trying to get some clues but i always fall back to looking at other charts. the best charts i’ve used are pac charts (price activity chart), and equivolume candlesticks.
Hi Jim!
It was my fault about the comments. I accidentally didn’t have them enabled! Mea culpa!!
I know Mark Ansel uses Market Profile for his Night Owl Trade Alerts (https://aeromir.com/nightowl) but he said he uses it in a different way than they were designed to be used.
Is your website publicly available?
Yes, Tom, your comment is correct. I do use Market Profile in Night Owl™. Indeed, I’ve adapted Market Profile into Night Owl™ in a manner for which Market Profile never was intended. And by doing so, it increased the accuracy percentage of Night Owl™ by about 7 percentage points.
One of the components of the popular Night Owl™ trading model here at Aeromir is Market Profile. I adapted Market Profile into the Night Owl™ model back in 2012. Since introducing the Night Owl™ Advisory Service to Aeromir members in October 2018, Night Owl™ has called the next day’s market direction correctly in 50 out of 63 calls, all of which were posted here at the Aeromir site one day in advance.