
Volatility levels are widely used by traders when making a decision to enter or exit a position. Understanding the differences between the various metrics of volatility can help gauge option pricing, and can be essential in your efforts to be more consistently profitable in your trading.
Implied Volatility Percentile (IVP) or Implied Volatility Rank (IVR) are two tools which can be used to track historical volatility. Using these tools will show you where the current IV number is in relationship to what volatility has been in the past.
When you learn to use the relationship of the current implied volatility and compare it to historical volatility by using either IV percentile (IVP) or IV rank (IVR), you will have an edge in your trading for many strategies. When you compare IV to IVP or IVR, it is important to use IVP consistently or IVR consistently. Comparing the current IV to both IVP and IVR can lead to confusion. It is important to either use IVP or IVR. Using IVP one time and IVR the next time is not recommended. Stay consistent.
When you look at the implied volatility (IV) of an option, it is reflecting the current IV. It is important to understand the relationship of the current volatility to the past historical volatility. This will help to determine what type of trading strategy to use when you enter a trade.
The can give your trading an edge.
To start, let's review the basics of Historical and Implied Volatility
What is the definition of Volatility?
- Historical Volatility is a measure of past performance. Because it allows for a more long-term assessment of risk, historical volatility is widely used by traders and market analysts in the creation of investing strategies. Historical volatility is also referred to as realized or statistical volatility. For the purpose of this article, I am using current IV percentile as historical/statistical IV. IV Rank is another method to determine historical IV which you will also learn about in this article.
- Implied Volatility (IV) is the estimated volatility of a particular stock/index. IV is a calculation which reflects the current volatility. In general, implied volatility increases when the market is bearish, when investors believe that the underlying price will decline over time. Generally, implied volatility decreases in a bullish market, when investors believe the underlying price will rise over time. If there is a sharp move upward in price, there are instances when short term volatility may increase.
How can Implied Volatility affect Options Traders?
- Implied volatility is one of the key factors in the pricing of options. Options give you the opportunity to purchase or sell an underlying at a specific price during a pre-determined period of time. The higher the implied volatility, the more premium the option will have. The less the implied volatility, the less the option's premium.
- Knowing the relationship between implied volatility (IV) and current IV percentile can allow you to determine if an option is more inexpensive or expensive…
- Implied volatility has the biggest effect on the amount of extrinsic value in the price of an option. When IV increases, the extrinsic value of both calls and puts increases. This makes the call and put option prices more expensive. When IV decreases, the extrinsic value of both calls and puts decreases. This makes the option prices less expensive. If you would like to read more about the intrinsic and extrinsic value of options, here is an article published on August 17, 2018: Intrinsic and Extrinsic Value of Options
An option's value is determined by the following components:
- Stock Price
- Strike Price
- Time to Expiration
- Volatility
- Interest Rates
- Dividends
Five of these components are easy to determine. They are basically fixed. The one which is unknown is volatility. As volatility goes up or down, it can reflect significant changes in the price of an option. Two of the most important components of an option's price are volatility and time to expiration. These two components can greatly affect your overall profit and loss. When you purchase an option, it is not enough to be right on market direction. You also have to be aware of time decay, volatility, and the relationship of current IV to its historical IV.
What is IV Percentile?
Implied Volatility Percentile (IVP) can provide traders with an additional metric to help gauge the pricing of options. IVP will tell you the percentage of days over the past year that implied volatility traded below the current level.
To explain IVP, let's start by looking at the current implied volatility using the S & P 500 Index as an example.
The one year chart of SPX is shown below, showing the current implied volatility of 21.67%.
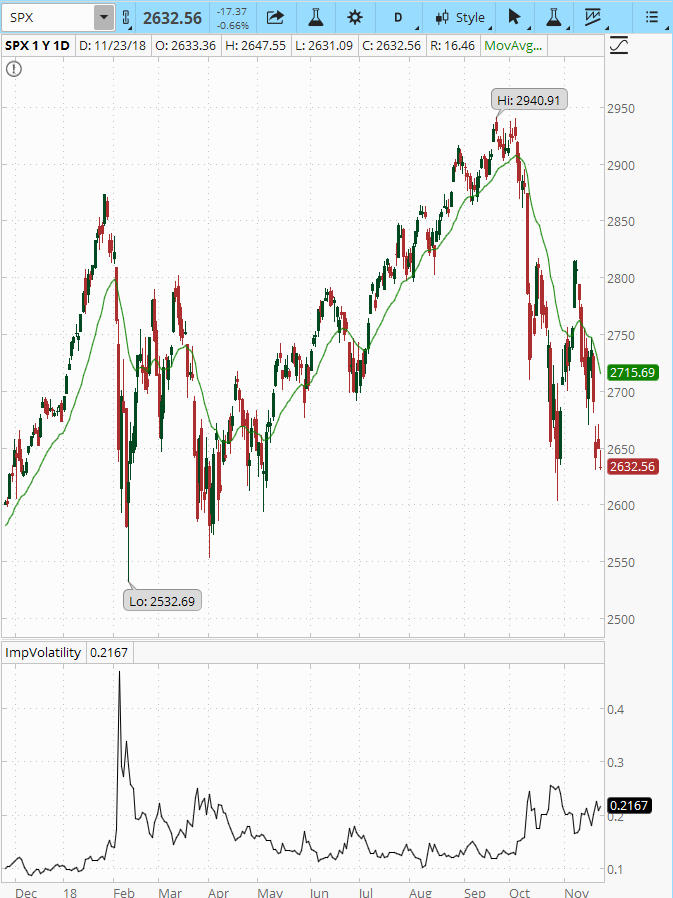
Figure A. One Year SPX Chart indicating current Implied Volatility
Below is a screenshot taken from the Think or Swim option chain.
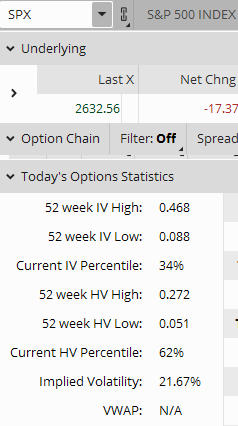
Figure B. Today's Options Statistics from Think or Swim
One way to find Current IV and IV percentile on the Think or Swim platform is to scroll down to the bottom of the option chain and look for Today's Options Statistics. It shows the Implied Volatility of 21.67%, as well as the Current IV percentile at 34%.
The current IV Percentile is calculated by taking the number of trading days the IV of SPX was below its current level and dividing it by 252 (the number of trading days in a year). The current IV Percentile in this example is 34%.
Using this example with IVP at 34%, the understanding can be that implied volatility of SPX traded below the current implied volatility of 21.67% for 34% of the past year, or about one-third of the year. This indicates that SPX IV was below 21.67% for about one third of the year. For two-thirds of the year, the implied volatility was above the current level of 21.67%.
This means that the current IV of SPX in relationship to its historical past is in the lower one third region. Therefore, option prices will be less expensive or “rich” than if the current implied volatility was at higher percentage.
How do you know if the IV of an option is high or low in relationship to itself?
Here is an example:
Stock ABC ‘s current price is currently trading at 50. The implied volatility of the stock is 20.0%, and the IV percentile is at 80%. Looking at an implied volatility of 20.0% you, would probably think the current IV was on the lower side.
Look at the Implied Volatilty Percentile. It is at 80%. What does this mean to you? It means over the past year 80% of the time ABC’s current IV was below 20.0%. This indicates ABC options are probably costly due to the current implied volatility of 20.0% relationship to the implied volatility percentile of 80.0%.
Remember, the current IV of 20.0% was lower 80% of the time over the last year. This shows the current IV to be high. This will make options more expensive or “rich”.
Implied Volatility Rank is yet another volatility metric that many traders take into account when making their trading decisions…
Implied Volatility Rank (IVR) can tell you whether the current implied volatility is high or low based on the IV over the past year. It is an average of the highest high and lowest low volatility for the past 52 weeks. Other time periods can be used such as 30 days with some trading platforms.
Let's use the same SPX example for one year to calculate IVR. The 52 week IV high was .468, and the 52 week IV low was .088. The formula used for a one-year IV rank is as follows:
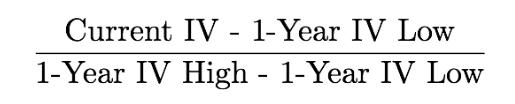
Figure D. IV Rank Formula (photo courtesy of www.projectoption.com)
To calculate the one year IVR, look at the options statistics in Figure 2.
With SPX IV currently at 21.67%, the IV Rank would be calculated as follows:
Current IV (.2167) minus 1-Year IV Low (.088) = .1287
1-Year IV High (.468) minus 1-Year IV Low (.088) = .38
.1287 divided by .38 = IV Rank of .338 or 33.8%.
This IV Rank of 33.8% indicates that the current IV and the low IV is only 33.8% of the entire IV range over the past year. This means the current IV is closer to the low end of historical levels of implied volatility.
At the extreme levels, an IV rank of 0% means that the current IV is at the lowest point of the one-year range, and an IV rank of 100% means the current IV is at the highest point of the one-year range.
How can you take advantage of the relationship between current Implied Volatility and IV Percentile or IV Rank?
You can base the type of trade you place using Implied Volatility, IV Percentile and IV Rank. As you know, there are risks and rewards with every type of trade. A few strategies for consideration using high and low volatility levels are:
High Volatility Could Indicate Opportunities to Sell
You expect volatility to decrease, thus the option you sell could decrease in price, making it profitable.
- Credit spreads. When you sell a credit spread, you will receive a higher credit when volatility is high.
- Iron Condor. When you sell an Iron Condor, you will also receive a higher credit when volatility is high.
- When you buy a Butterfly in a high volatility environment, your position will benefit as volatility drifts down, as long as the underlying price stays close to your short strike.
Low Volatility Could Indicate Opportunities to Buy
You expect volatility to rise, therefore, the option you buy could become worth more.
- Long put or put debit spread. This trade can allow you to lower your cost and benefit from a spike in volatility.
- Long Calendar spread. This trade could benefit from the back month volatility increasing while the front month options decay.
- Iron Condor. The Iron Condor tends to perform better in higher volatility markets, but can still do well in lower volatility markets.
When you base your trade strategy on the relationships between Implied Volatility, and IV Percentile, and IV Rank, it does not guarantee that your trade will be profitable. However, it does give you a tool to use for your trade entries and exits so volatility can have a chance to work in your favor.
Do you have a trading method using volatility you would like to share? Please feel free to comment below.
Hi Joanna,
Thank you for amazing article. Quick question : I like to buy options instead selling them as seller’s risk is unlimited.
I have scanner that filters out stocks according to my requirement which is buying.
It is, HV > IV and IVP in the range of 0-25. Can i buy PUT option using this criterion?
If not can u please suggest me the change?
Thanks in advance
Regards,
Rohan
Hi Rohan!
You certainly can buy Puts with low IV. Selling and buying at the same time to create a vertical spread has defined risk and neutralizes the volatility and vega effects compared to owning a single long or short option.
Buying puts with low IV is a good hedge if you think the underlying will decline. You are fighting a headwind with the Theta decay. The further from at-the-money your option is, the less Theta you are losing. Buying a put normally is done if you think the underlying will decline or to protect a long stock position.
I created an account for you in our community so you can ask questions in our forums and trading groups.
Market Chameleon has really good scanning tools as well. https://aeromir.com/mc
This article is incredibly useful.
Thanks guys and keep up with the good work.
Hello Joanna
Thank you for writing this very detail article about IV. It is by far the best that I have read and finally have a complete understanding of this indicator.
Please keep up the good work that you do in furthering our knowledge in the option trading arena.
Regards,
Pierre