Jim Riggio put an SPX trade on about two months ago when the SPX was at 2000. Jim put a 90-day (DEC expiration) 1975/2000/2025 butterfly on. Nothing fancy or unbalanced. I put the same trade on the next day.
Jim and I took two different approaches to managing the trade
Jim was a “set and forget” while I started making the trade a broken wing butterfly as the market started moving down. My trade made a $1256 profit in just short of two months on about $7500 of margin used in the trade. That's a return of +16.75% in two months.
But what does this have to do with that duck?
The way I managed the trade was to lift the downside and lower the upside. I was “floating” the expiration profit/loss up and down, as the market moved. Just as a duck floats on the water and goes up and down with the tide, I was floating my expiration profit/loss lines up and down.
Does it work when the market goes up?
Of course. I put the next floater trade on about a week ago with SPX around 1958. SPX is now at 2018 and I've “floated” my call side up above $0 profit at expiration. Let me show you.
Trade Entry
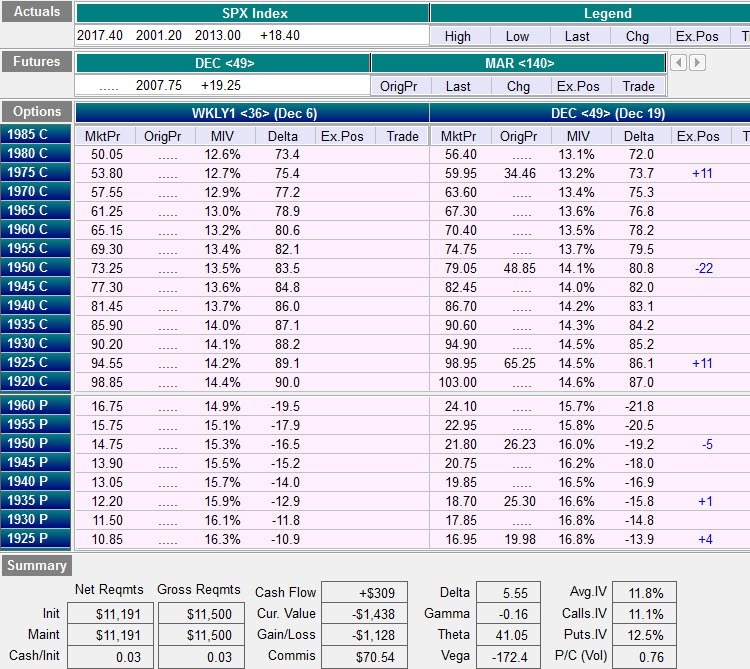
OptionVue Matrix: SPX was at 1958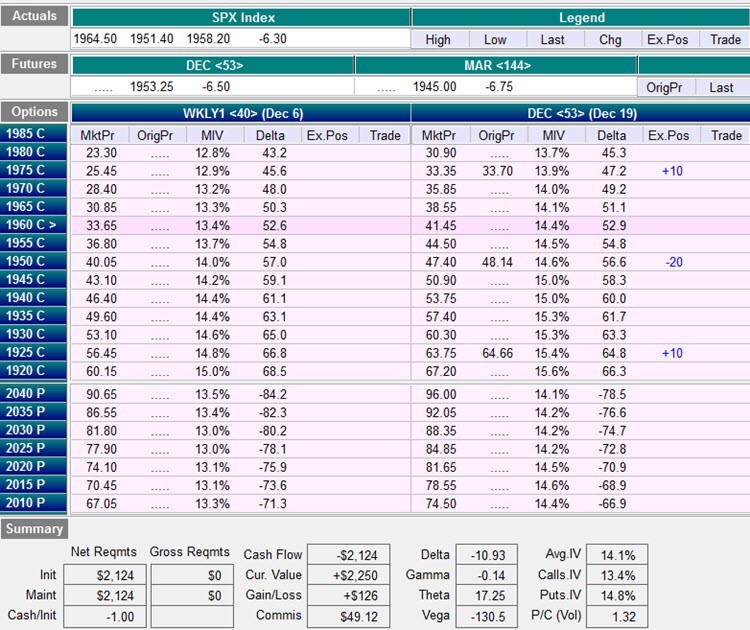
Notice how narrow this butterfly is. The probability of profit at expiration is only 12% if you don't make any adjustments. Also notice how much time premium is in this trade. Because you are selling at-the-money options, you collect a huge amount of time premium to play with.
Notice how narrow this butterfly is. The probability of profit at expiration is only 12% if you don't make any adjustments. Also notice how much time premium is in this trade. Because you are selling at-the-money options, you collect a huge amount of time premium to play with.
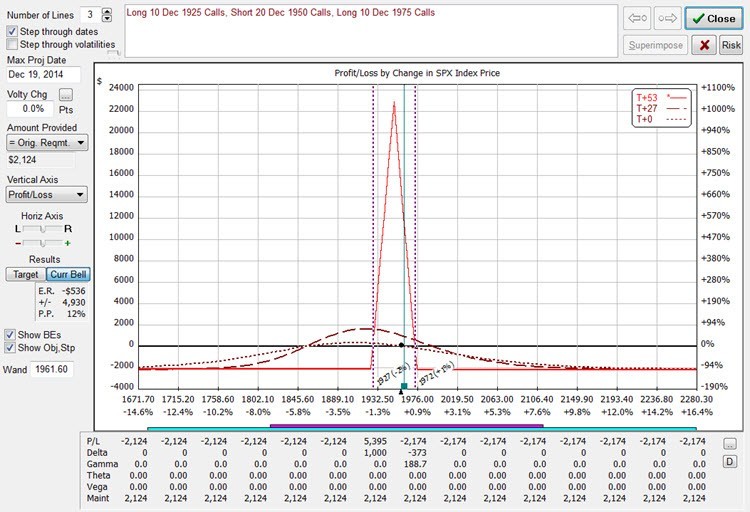
The First Adjustment
The next day, SPX starting roaring to the upside. I made my first adjustment by simply adding a bull call spread at 1950/1925. I'm generally trying to use the same strikes. It doesn't matter if I use calls or puts. Vertical spreads at the same strikes are the same. One is a credit and the other is a debit, but the risk/reward is identical. I'm also trying to use strikes at major price levels as those strikes are more heavily traded.
Notice how the symmetric butterfly has changed to a broken wing butterfly
Fast forward a few days to Oct 30th.
SPX kept rising and I floated my call side up and the put side down a little more. This was because SPX is now well above the expiration break even and I needed to keep flattening the T+0 line. Here's what the trade looked like at the end of the day on Oct 30th:
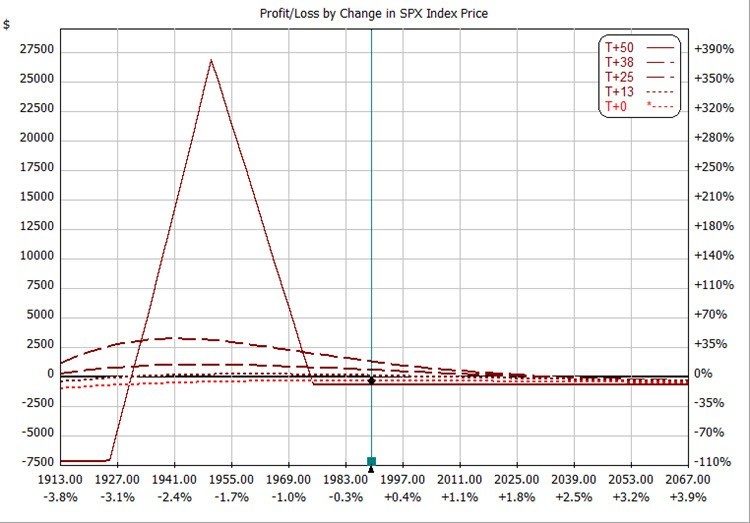
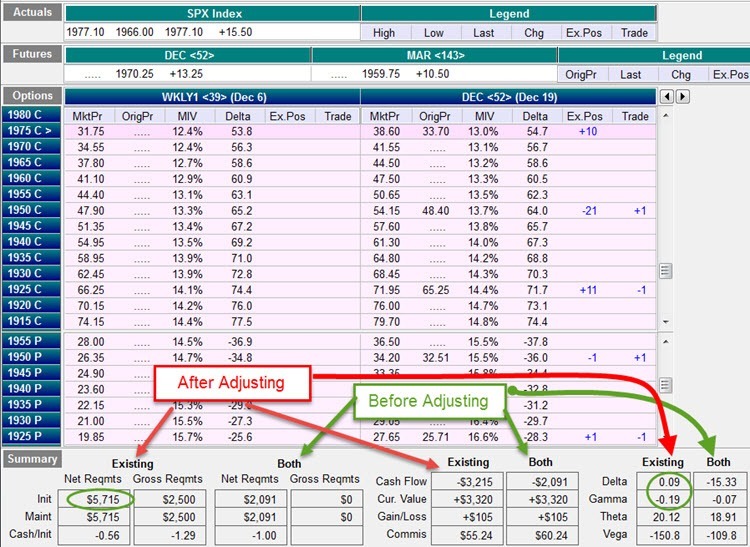
Current Position
SPX is now at 2018 and I've floated the call side up and the put side down a bit more:
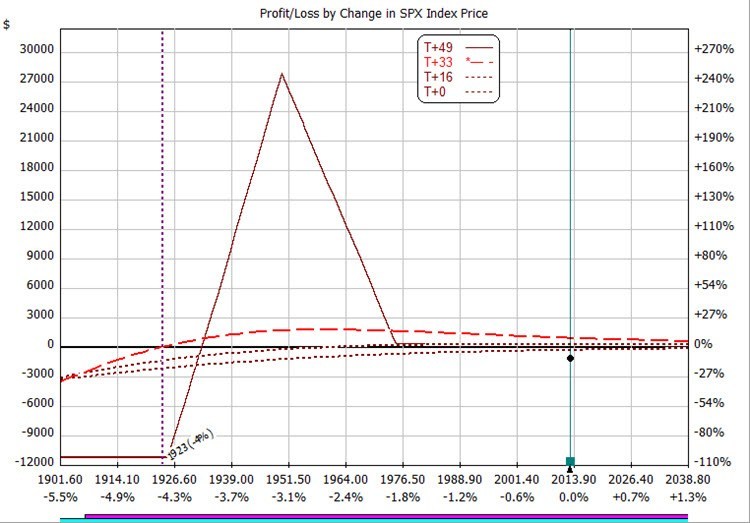
Notice the call side expiration profit is now above zero. The put short strike deltas are at -19.2 so the probabilities are shifting in the trade's favor. The probability of profit in 33 days is about 80%.
Summary
This is a trade in development in my “test kitchen.” I need to spend some time back testing this. I need to develop a set of rules for the trade, but at the moment, it's a trader's trade. The main goal is to keep the T+0 line pretty flat and the risk under control.
I like this trade for several reasons:
- You start with a lot of time premium to play with so you can make a good number of adjustments without ruining your profit potential
- The trade starts market neutral. You let the market tell you which way it wants to go and you react to that.
- If the market goes sideways, you start with good theta so you can make a profit relatively quickly.
- Risk is very low. The T+0 line is FLAT. My 10 lot butterfly was only $2000 in margin to start with. If we had a flash crash, that's the most I could lose.
- Because I'm starting farther out in time, short term movements don't need to be reacted on in the same way with a shorter time frame trade.
What do you think?
I'd love to hear what your thoughts are for this trade. Either reply in the comments below or join us in the forums to discuss this trade at http://forums.capitaldiscussions.com/
Confusing.
You start off saying that it is a Call Butterfly, but then, out of nowhere, you are adding Puts, without explaining where they came from.
Hi John,
As I said in the article, it doesn’t matter if you use calls or puts to build a vertical spread. They have both have identical risk if you use the same strikes and expiration. One is a debit and the other is a credit. I was using put verticals to tweak the butterfly I initially created with calls.